ChOTD-4/17/14 The Long and Short of General Electric (GE): Charts Do Not Justify Bullishness
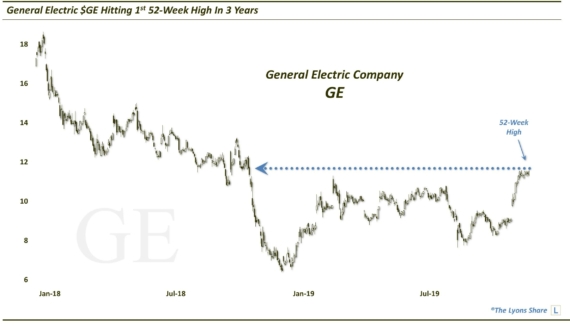
If General Electric is still considered a bellwether for the economy or market, a look at the long-term and short-term charts suggests there may be trouble ahead. First the long-term:

While most major averages have made all-time highs this year, GE’s stock price has failed to even come close. In fact it has failed at 4 major long-term technical levels:
- The post-2000 down trendline
- The 38.2% Fibonacci retracement of the post-2000 decline
- The 61.8% Fibonacci retracement of the post-2007 decline
- The high-volume breakdown level from the fall of 2007
These are all significant hurdles that, until overcome, present major challenges for GE’s stock. Now the short-term:
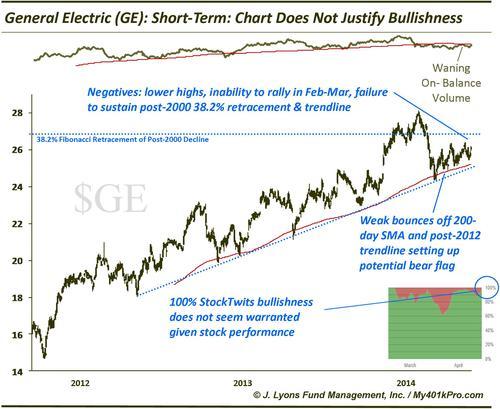
There are many troubling developments on this chart. First, the stock is making lower highs. It could hardly muster a bounce off of its February low, despite the broad market rallying to new highs. Speaking of bounces, the recent bounces off of the post-2012 up trendline and 200-day simple moving average have been weaker and weaker. This action is setting up a potential bear flag, presumably to be resolved with a trendline break and a leg lower. Additionally, its on-balance volume has weakened this year and is now firmly below its trend for the first time in over 2 years. Finally, the 100% bullish sentiment reading according to StockTwits respondents screams contrarian bearish to us.
Perhaps there is something fundamental that we don’t look at to justify this bullishness in the stock…and perhaps earnings will propel it above the key long-term levels noted above. However, until that happens we see very little on the chart to be constructive about.