ChOTD-4/23/14 Stock Prices vs. Long-Term Trend @ Secular Bear Market Extremes
An excerpt from our May Newsletter “2014 Secular, Ahem, Bear Market Update”:
Price
The most obvious way to consider cycles is in terms of price. During a bull market, prices go up and during a bear market, prices go down. And per Newton, the farther they go up, the farther they tend to correct, eventually. As we have discussed many times, however, during a secular bear market, prices do not necessarily decline the entire time, otherwise equity markets would be roughly where they were 200 years ago (although, on an inflation-adjusted basis, that is probably closer to reality than most people think.) No, during the duration of a secular bear, prices merely do not go up. This is where “time” factors in again. There is an old adage that markets can correct either in price or in time, i.e., by going sideways for an extended period. A correction in time is what often occurs during a secular bear.
The extent of a secular bull market rally elicits an obvious, measurable “action”. However, to satisfy Newton’s law, we must determine what constitutes an equal reaction in prices during a secular bear market that goes sideways. To aid in this endeavor, we can use some math to figure out to what extent prices vary during a secular bull and bear market relative to their long-term trend. In the chart below, we apply an exponential regression line to the Dow Jones Industrial Average, producing a trendline that best represents the market’s long-term trend, or norm.
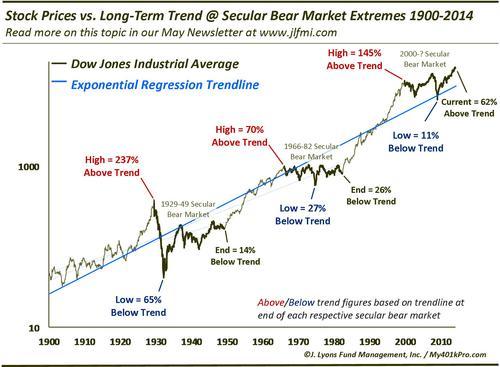
The labels on the chart indicate how far above (overbought) or below (oversold) the market got relative to its trend at secular bear market tops, bottoms and ends (the figures are calculated as of the end of each respective secular bear market so that trend is not effected by future prices.) At the 1929 top, the Dow reached a staggering 237% above trend. Such a severe overbought level would imply an equal and opposite reaction to the downside. Sure enough, at the subsequent price low in 1932, the Dow had fallen 65% below trend. And while the low was established just three years in, as we discussed, time is an important aspect to the secular cycle in order to make long-term repairs to excesses that can’t be fixed through one quick crash in price. Thus, the market generally moved sideways for the next 17 years. The sideways action resulted in a market that at the end of the secular bear was still 14% below its long-term trend – and in position to support a new durable secular bull market.
Likewise, at the 1966 secular top, the market had reached 70% above its long-term trend. At the 1974 secular bear low, it was 27% below trend. While that perhaps does not seem to fit the “equal and opposite” bill, the time factor again played a significant role in repairing market excesses during the 1966-82 secular bear market. After generally going sideways for another 8 years, the market was still 26% below trend when the secular bear ended in 1982, even though the Dow was 30% higher than the 1974 low.
Comparing the current cycle to those historical precedents makes it clear why we do not believe the excesses built up by the end of the secular bull market in 2000 have adequately been worked off. At the 2000 top, the Dow was 145% above its long-term trend. At its low in 2009, it reached a mere 11% below trend. Furthermore, it only spent 2 months below trend, the only 2 such months in the last 22 years. This hardly constitutes an equal and opposite reaction to the extraordinary heights reached in 2000. So what would? Ominously, an instantaneous drop of 38% would merely bring the market back to its long-term trend. Alternately, so would a market that goes sideways for the next 6 years. Again, that only gets the market back to its trend. To satisfy the equal and opposite law would require even much more dire scenarios than those.