UPDATE: Tesla $TSLA & Facebook $FB Challenging Major Fibonacci Retracement Levels
We seldom post on individual equities but we thought we’d update a couple of charts that we’ve tracked in the past, Facebook and Tesla, due to popular demand. The prompting of these updates are the proximity of the stocks to a key Fibonacci level.
$TSLA: In an April 15 UPDATE on $TSLA, we noted it had broken a key Fibonacci Support cluster around 206 and that the next cluster of support lay arounf the 174 level. The stock bottomed at 177 on May 9 and has not looked back since.
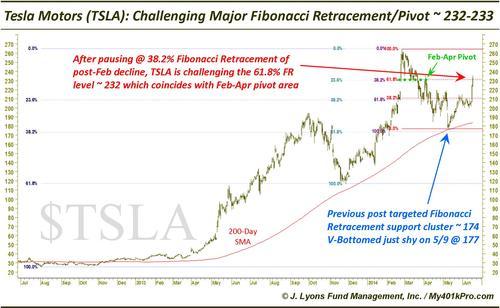
After pausing for a couple weeks at the 38.2% Fibonacci Retracement of the February-April decline around 211, it has broken out strongly in recent days. Currently, it is challenging the 61.8% retracement level around 232-233, which also matches up with the pivot area from February to April.
$FB: In a March UPDATE, we mentioned a break of the 61 level opened up a drop to the 53-54 area. $FB hit a low on 4/28 of 54.66, a 61.8% retracement of the November-March rally almost to the penny (54.64).
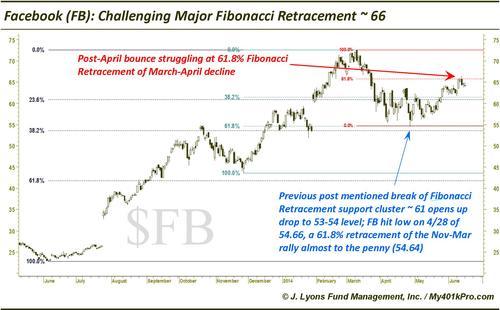
Facebook has now bounced since to the 61.8% Fibonacci Retracement of the March-April decline, where it is struggling.
What’s next for the two stocks? The 61.8% Fibonacci Retracement of recent declines poses formidable resistance for these two stocks. Which one has the better chance of breaking through? It’s a tough call. The violence in which Tesla sold off suggests a higher probability of its recent high being a “top”. However, the violence in which the stock bounced in its recent two-day pop suggests the significant resistance at this level may have a tough time holding the stock down permanently. We would simply focus on the 61.8% Fibonacci levels. If either stock breaks through, it should have a decent shot at challenging all-time highs.