ChOTD-7/7/14 Worst U.S. Weather/Climate Disasters By $ Cost Vs. GDP (1980-2014)
A couple weeks ago we posted a table of the 25 Worst Quarterly GDP Prints in U.S. History, which included the 1Q 2014 reading of -2.96% at the #17 spot. The table caught a bit of fire in the Twittersphere, thanks to a retweet and subsequent post by Josh Brown (@reformedbroker). Others (including Jon Boorman @JBoorman, Andrew Kassen @andrewunknown and @marginalidea) posted informative follow-ups related to stock market performance subsequent to the weak GDP prints. The inspiration behind our original posting of the table, however, had nothing to do with stock market performance. The sole purpose of the post was to present a data-based counter-argument to the seemingly unanimous voice of mainstream media pundits and investment bank economists casually suggesting that the GDP print be dismissed out-of-hand as a weather-induced aberration. To us, the suggestion seemed somewhat outrageous considering, as the table showed, the -2.96% print was nearly twice as bad as any in history not associated with a recession. We’re not saying that a recession is at hand necessarily. There is a first time for everything. All we are saying is that the reading should not be so casually dismissed.
Today’s ChOTD is a follow-up table taking to task the object of our other objection surrounding the 1Q 2014 GDP release: the weather excuse. Presented here is the list of the top weather/climate disasters, based on economic damage, in the U.S. from 1980-2014 and the GDP reading for the quarter(s) during which each event took place. We also included the 1Q 2014 GDP print for the sake of comparison (for those wondering, the disaster data comes from the National Oceanic and Atmospheric Administration, the official scorekeeper of such data. Economic costs related to disasters before 1980 were not included as they were not readily available).
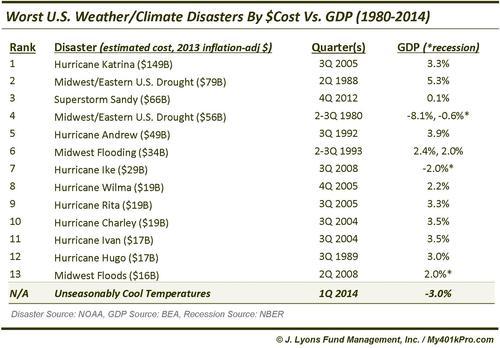
The first thing that jumps out at us is that, by and large, these disasters were not accompanied by concomitantly weak GDP readings. In fact, only 2 of the worst 13 disasters saw negative GDP’s during the quarter(s) they took place. And those 2 (1980 and 2008) occurred when the U.S. was already in a recession (as later determined by the National Bureau of Economic Research). GDP during the other 11 disaster-related quarters averaged +2.9%, with 7 of the 11 sporting prints of +3% or higher. Additionally, there were two quarters (3Q 2004 and 3Q 2005) that had the misfortune of experiencing more than one of these worst disasters. Despite the duel challenges, those quarters recorded +3.5% and +3.3% GDP figures.
Now let’s assume (generously) that the “unseasonably cool temperatures” were in fact the cause of the negative GDP print in the 1st quarter. That would imply that weather shaved more than $118 Billion off of GDP from the 4th quarter of 2013. That sum would make it the 2nd costliest “weather disaster” of all-time, after Hurricane Katrina. And that merely gets GDP to positive territory from -3%. If, hypothetically, we assume that the disasters above caused a 3% reduction in concurrent GDP (rather than merely the estimated costs in the table), the non-recession disaster-related quarters would have averaged nearly +6% GDP readings. Readings that high have only occurred in 10% of the quarters during this entire period.
We’re not suggesting that weather played no part in the weak 1Q GDP number. Perhaps it did. We simply take exception to the suggestion that a -3% GDP print be written off as a “weather-induced” outlier. This is particularly so when comparing the figure with historical GDP readings occurring during quarters encompassing the worst weather-related disasters in U.S. history, which generally fared just fine. Perhaps we’re just not smart enough to understand the nuanced effects that cold weather can have on 3 months of economic activity across 50 states. But when we see a GDP figure that far outside the norm of even disaster-related quarters, it raises our BS-meter.