One Major Obstacle To This Breakout In Financials
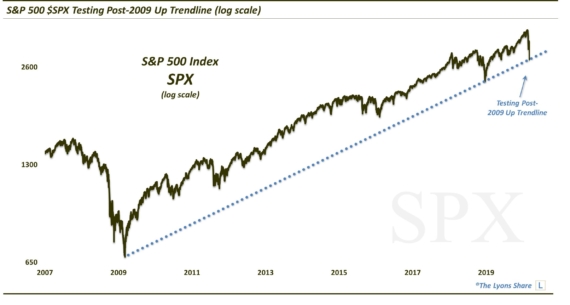
There has been quite a bit of chatter recently regarding the relative weakness on the part of financial stocks. A concern by many was that, as the old adage goes, the market might have a difficult time making progress without participation by the financials. We do not necessarily share that view. From our observation, the leadership dynamics of each cycle are different. And while it would be great if the financials were showing strength commensurate with the current rally, there is no shortage of sectors still providing leadership.
That said, the financial sector (as represented by the Dow Jones U.S. Financial Index as well as the Financials SPDR, XLF) did break out to new rally highs in the past few days. So give credit where credit is due. The more sectors making new highs, the merrier as far as bulls are concerned.
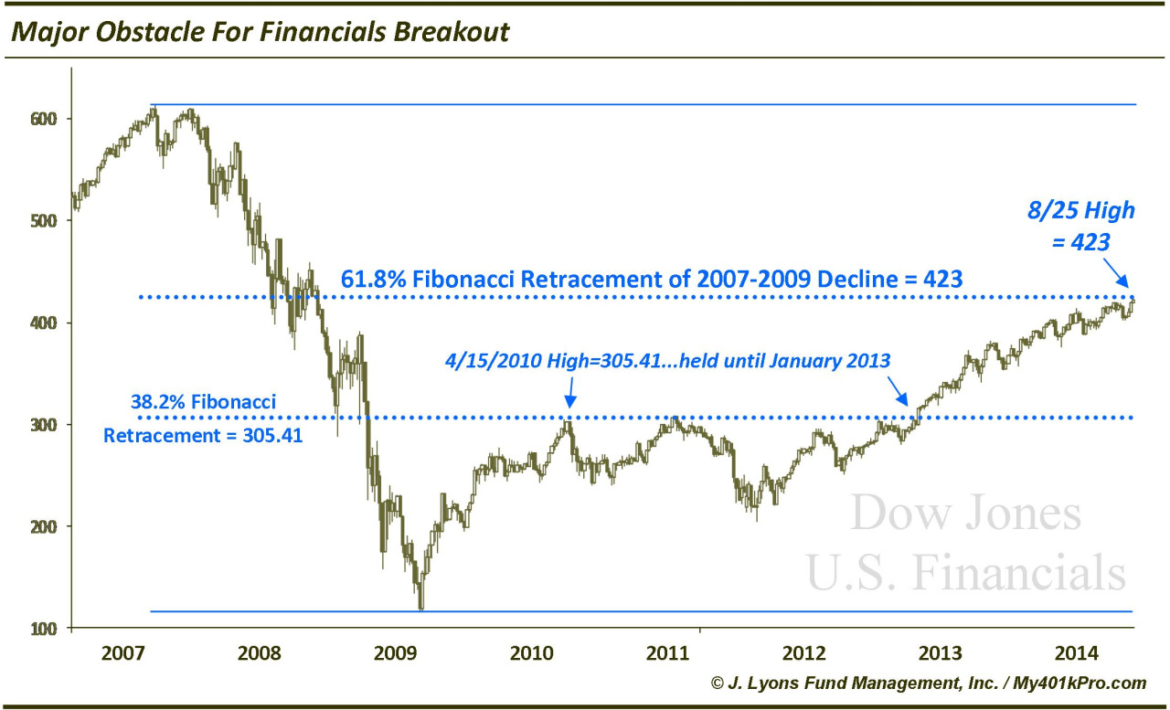
We do see one major challenge to this breakout in financials, however. As of this writing, the DJ U.S. Financials Index is trading at 423. The significance of that number is that it is the 61.8% Fibonacci Retracement, to the point, of the decline from 2007 to 2009. Yes, it did trade up to 424 today, but let’s not quibble over one point given the analysis spans more than 7 years. In fact, even if it overshoots temporarily by a few percentage points, we would not be surprised to see the level act as a magnet – or hurdle – sooner than later.
Why are we wary of this level when the financials have just broken out to new highs and the chart thus looks wide open above but for this seemingly arbitrary number? We’ve talked about Fibonacci levels many times regarding their propensity to hold relevance in financial markets (not to mention nature and other walks of life). The 61.8% level is the most significant of the levels. Do they work all the time? No, nothing does. But they do work often enough that they merit consideration in a trading strategy should one be so inclined to explore the topic.
Furthermore, as we’ve stated before, when gauging the potential influence Fibonacci levels may have on a market, it is instructive to look to see how the market has respected, or adhered to them in the past. In this case, the 38.2% retracement (the 2nd most influential Fibonacci number in our opinion) of the the 2007-2009 decline equates to 305.41. That happened to be the exact high in the DJ U.S. Financials Index to the penny on April 15, 2010. Except for one week in 2011, that high held for nearly 3 years. That, we would say, is respecting the level.
FYI, one more thing about Fibonacci numbers. We certainly understand folks may be skeptical of their influence on markets (it’s voodoo, it’s lazy, markets move at random, etc.). Just understand that big banks that run a lot more money than most of us will ever sniff use Fibonacci analysis. That alone can have an impact on your investments.