Bull Flag Signaling 1 More Chance To Buy This Biotech ETF?
Biotech stocks have alternated between hero and villain in 2014 (FYI, we have been on either side of this sector at times this year). After rocketing higher to begin the year, the sector abruptly halted its parabolic rise in February and began an equally rapid descent. To be honest, we thought the bubbly sector had popped. However, it came roaring back to life over the past few months to make new highs (to our surprise) and resume its leadership role.
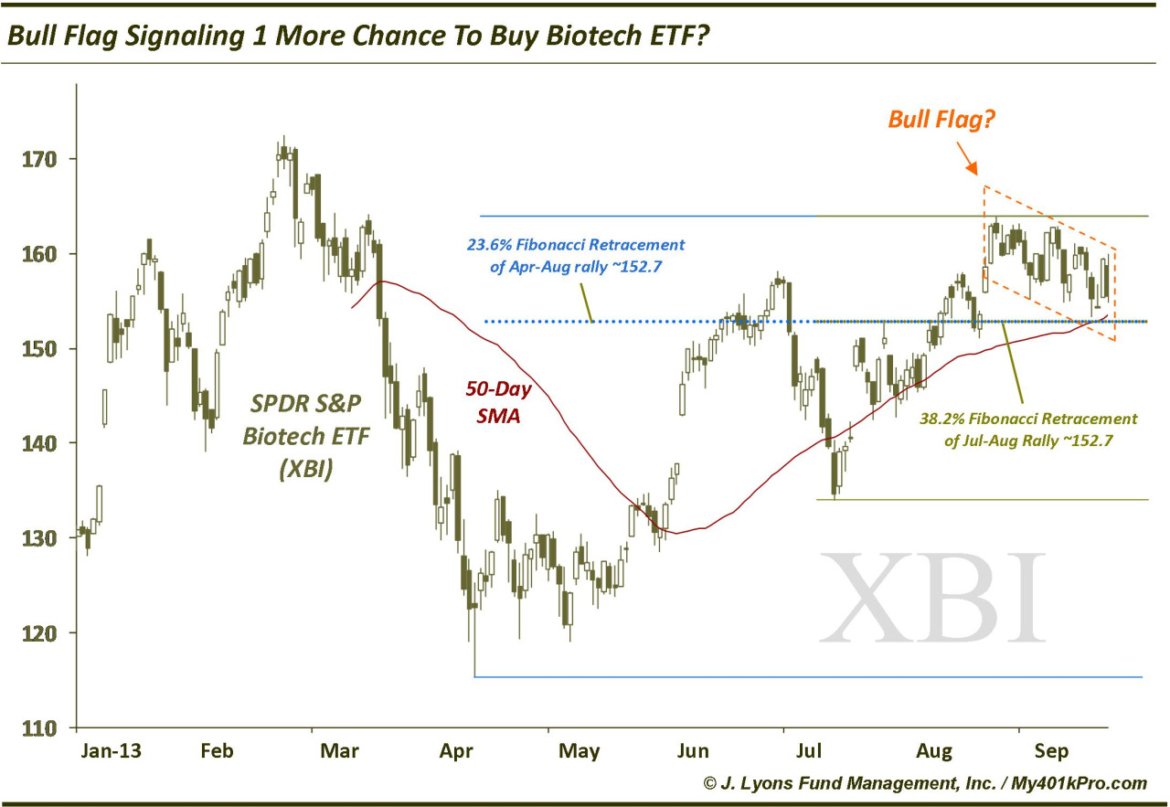
Many people have been left out of this latest run higher, ourselves included. However, the opportunity may not be over. While the Biotechnology Index ($BTK) and iShares Nasdaq Biotech ETF ($IBB) have made new highs, the broad, more equally-weighted SPDR S&P Biotech ETF, $XBI, has not. It is currently presenting a compelling entry point, however, to make a possible run at new highs itself.
The rally in XBI off its April low made it to just above the 78.6% Fibonacci Retracement of the February-April decline. It has consolidated those gains nicely, and tightly, in a possible pattern called a Bull Flag. This pattern is a continuation pattern, meaning it should break out eventually and “continue” its previous trend (up). The bottom of the Bull Flag (currently is around the 153 level. XBI made a low today (so far) of 154.88 so it is approaching that level.
In addition, the following layers of support lie in the same vicinity:
- 50-Day Simple Moving Average ~153.5
- 23.6% Fibonacci Retracement of the April-August rally ~152.7
- 38.2% Fibonacci Retracement of the July-August rally ~152.7
- August 22 breakout gap ~153.63
This approximate level gives traders an attractive entry point on the long side. A close below about 152 would negate the Bull Flag as well as breaking the other support layers. While support below would come in at around 145 (200-Day SMA, 38.2% FR of April-August rally & 61.8% FR of July-August rally), it would not be as high-odds a setup as currently, given the Bull Flag.
A break out above the Bull Flag would measure a target around the lows 170’s, or right at the former high. Other patterns involved in XBI measure quite a bit higher but we’ll cross that bridge if we get to it.
The fact that $IBB and $BTK still look solid in their potential to eventually further their moves into new high territory bodes well for $XBI and this trade as well. If you missed the Biotech train all year, this may be your shot to get aboard. We should find out pretty quickly either way.
________
More from Dana Lyons, JLFMI and My401kPro.

