The British Are Coming! FTSE poised for 15-year triple top breakout?

OK, so Paul Revere wasn’t talking about British stocks; but he might have been had he seen the potential development in the London FTSE 100. After closing at 6930 on the final trading day of the last millennium (12/30/1999), the index has remarkably failed to trade above 6900 one time since. Today, it came the closest it has in 15 years, hitting 6898. Should it break out above 6900, the FTSE has the potential to run significantly higher.
We never want to anticipate a breakout. And indeed, we have been watching for a breakout in the FTSE since January with nothing doing yet. That said, there is plenty to like about the chart and its potential to support a breakout.
For one, as we mentioned in the January post, there is a potential cup-and-handle formation on a long-term basis using the 2007 and May 2013 highs as the sides of the cup and the current high as the handle. Additionally, there is a potential cup-and-handle on a shorter-term basis with the May 2013 an May 2014 tops serving as the cup and the current high completing the handle. This is a powerfully bullish formation that can support much higher prices, upon a breakout.
Even if one does not interpret the action of the past 15 months as a cup-and-handle, it has at least consolidated very tightly up near the 15-year highs in the 6800’s. It is now like a coiled spring ready to accelerate out of the consolidation – whichever way it breaks. I like to think of it as a superball bouncing through a hollow tube. Once it reaches the hole at the end, it is released in a powerful burst. The fact that the FTSE has been making higher lows since 2013 as it has consolidated suggests that it is forming an ascending triangle, a pattern that typically resolves to the upside.
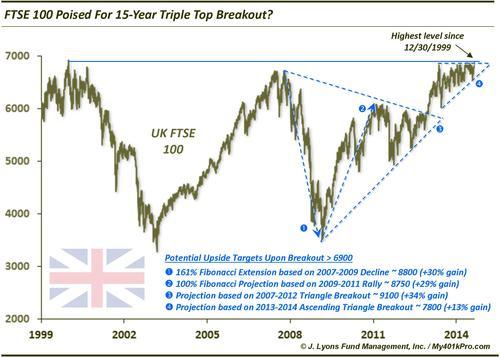
Whatever formation one interprets the recent action to be, it appears to be a continuation pattern of some kind – meaning it will resolve itself in the direction of the prior primary trend, i.e., up. Assuming a breakout to the upside, we can derive certain targets from various patterns in the chart. For the record, we are not big proponents of price “targets” per se, as we simply follow what prices are telling us. However, by studying the chart patterns, we can at least get a general idea of a chart’s potential. Here are some potential price targets suggested by various patterns on the FTSE chart:
- The 161% Fibonacci Extension based on 2007-2009 decline yields roughly 8800 (+30% gain)
- The 100% Fibonacci Projection based on 2009-2011 rally yields roughly 8750 (+29% gain)
- The projection based on 2007-2012 Triangle breakout yields roughly 9100 (+34% gain)
- The initial projection based on a potential 2013-2014 Ascending Triangle breakout yields roughly 7800 (+13% gain)
Again, we caution investors or traders against anticipating a breakout. This is particularly true of setups on a long-term scale such as this. Should the FTSE 100 break out, there is plenty of potential further upside to reap.
So wait til you see the whites of the eyes above 6900.
____
Read more from Dana Lyons, JLFMI and My401kPro.
Redcoat March photo by Jason Bolonski.