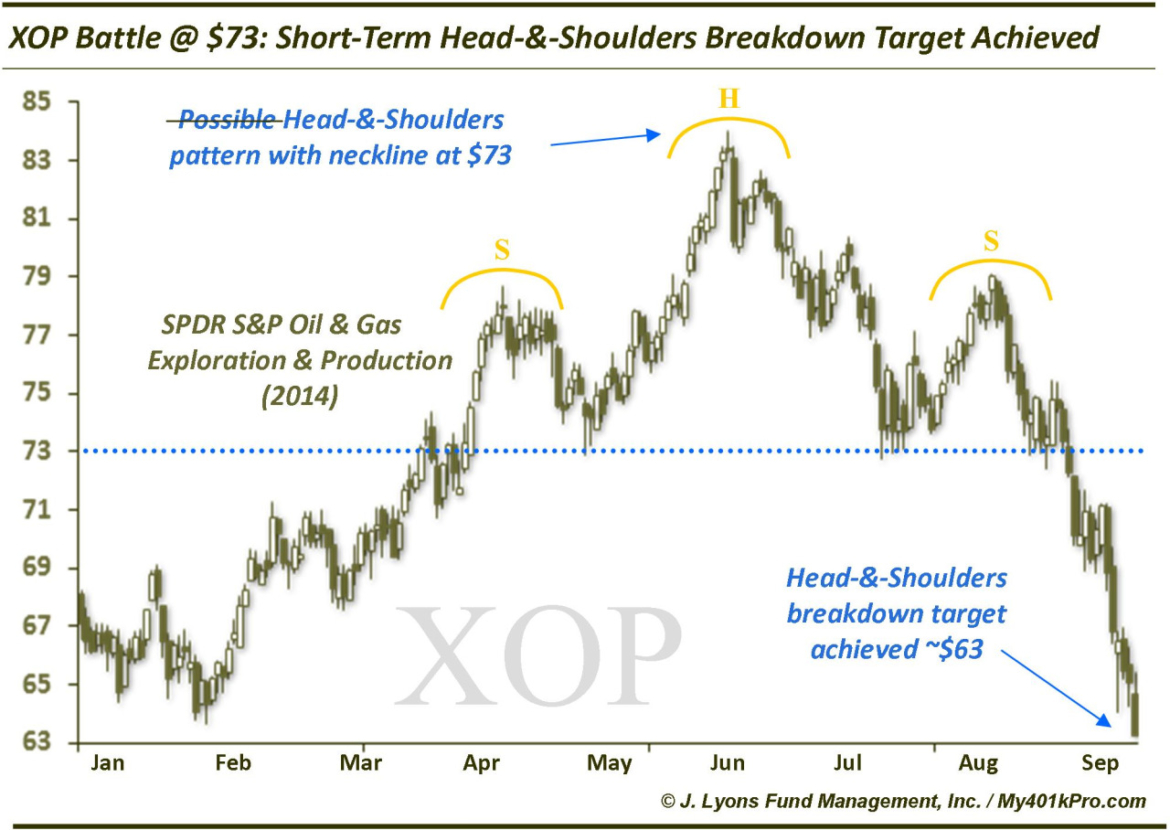
Oil $ Gas ETF Head-&-Shoulders Target Achieved
In a September 15 post, we labeled the SPDR S&P Oil & Gas E&P ETF (XOP) the “most interesting chart in the world”. The basis for that moniker was the battle at the $73 level between long-term support and a short-term head-&-shoulders formation of which 73 served as the neckline. We are updating that post here to say that the short-term forces won – and won big.
Four days after the post, XOP lost the 73 level, which it had held successfully no fewer than a dozen times since breaking above it in April. From that day forward, it has dropped…and dropped…and is still dropping. In the September 15 post, we stated that “…a break of $73 would target an area around $63”. XOP achieved that target yesterday, capping a stunning 13% drop in just 13 days.
The head-&-shoulders formation is one of the most often identified, and erroneously identified, patterns among chartists. However, the head-&-shoulder pattern does exist and does still work at times. When it does, one can see why it makes for such attractive pattern to identify.
__________
More from Dana Lyons, JLFMI and My401kPro.