Dubai: Another Desert Storm Brewing?
First off, this post has nothing to do with any military operations. It is one, a comment on our view of the Dubai stock market based off of its chart. Secondly, it is an example of how a chart – or asset price moves, in general – can foretell larger future developments.
Let’s look at the chart of Dubai’s Financial Market General Index. From the beginning of 2012 to May of this year, the DFMGI rose 315%. It gained 90% just since November of last year. The meteoric rise was halted abruptly, however, in May as the index crashed some 30% over the following 2 months from its high around 5400. It arrested its drop near the 3800 area, a level which we highlighted on June 24. Subsequently, the DFMGI began the healing process, during which it would be determined whether the index was A) ready to resume its long-term uptrend or B) destined to retest the crash lows. Our vote is leaning toward “B” at this point.
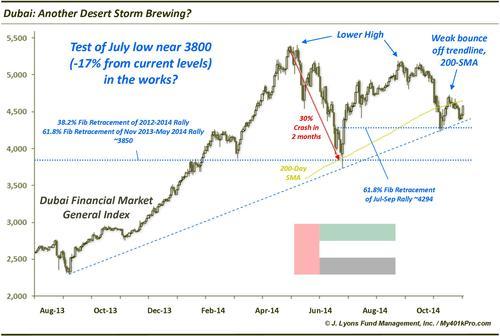
Why are we leaning toward a retest? For one, crashes typically see a test of their lows, whether quickly or months later. Witness the October 1987 crash that saw its lows retested in early December after a bounce. A 2-month bounce in the DFMGI into early September saw the index retrace roughly 88.6% of the crash declines. This was the final Fibonacci Retracement hurdle to overcome before it would have been a pretty sure bet that the index would be off to new high ground again, i.e., scenario “A”. However, the index could not quite overcome that level and has proceeded to falter again.
The failure in September was also important as it established a lower high on the chart. Another troubling development was the swiftness of its October decline, in concert with global equity weakness. Unlike many of its international counterparts, however, the DFMGI has only mounted a meager comeback from its mid-October lows.
The meagerness of the bounce is made more significant due to the location of the bounce. It occurred at both the 61.8% Fibonacci Retracement of the July-September rally as well as the rising trendline connecting the September 2013 lows and the July lows (as well as the December 2012 and April 2013 lows using a logarithmic scale). And whereas the bounce off that trendline in July was explosive and lasted for 3 and a half months, the recent bounce was mild in magnitude and lasted only 3 weeks before the index again returned to the trendline last week. Furthermore, while the 200-day simple moving average also served as support at the July lows, the index has now dropped below it.
To us, this points to the potential failure of the October low as well as the up trendline, and in fairly short order. Barring an immediate rally above the late-October highs, the index could be on its way back down to test the key 3800 area again. This represents a decline of approximately 17% from the DFGMI’s current level around 4600.
So what about the second point of this post – the larger context? Investors are always wondering about the origin of the next market “scare”. And while sometimes the negative catalyst is seemingly out of the blue, at times it is foreshadowed by the price action of a particular market. For example, the Russian stock market was showing significant weakness earlier this year before the Crimean crisis unfolded. It was a similar story with the Cyprus scare last year, the Greek issues in 2012 and this year and the Portugal issues this summer. None of those issues were “out of the blue”. The charts showed well beforehand that something unhealthy was going on.
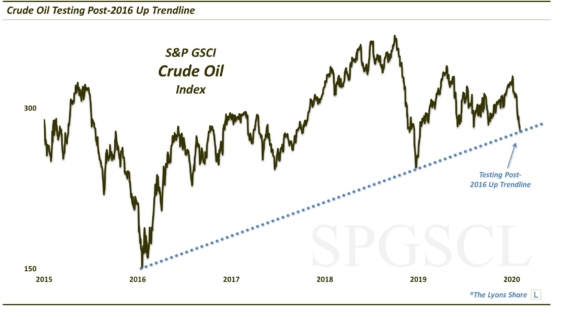
So is Dubai the next global “scare”? Since it already crashed earlier this year and since the potential weakness associated with a possible retest would amount to “only” about 17%, perhaps that is overdoing it a bit. Then again, anything that produces a drop of even 2% in the S&P 500 could be considered a scare these days. And should the Dubai Financial Markets General Index drop 17%, that would most likely produce some ripple effects globally, even if only in the very short-term. On top of that, such a hypothetical drop in the heavily oil-dependent region could very well transpire concurrently with a plunge in oil prices. While that development may or may not be welcome news in the long-run, in the short-term, it could produce various sharp dislocations in the financial markets.
Obviously, this is all conjecture based on a development in the Dubai stock market that has not even happened yet, and may not. However, it is an example of how price action can give one a tipoff of where the next trouble spot might occur in the markets, before it becomes apparent. That is the discounting genius of financial markets. Therefore, we wanted to post it beforehand, just in case something along those lines does unfold and we can make the point better than having to rely on hindsight.
Even at the risk of our crystal ball being faulty.
________
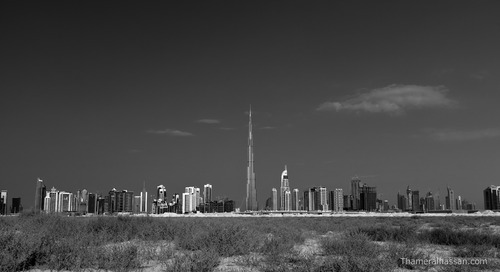
“Dubai Desert Cityscape” photo by Thamer Al-Hassan.
More from Dana Lyons, JLFMI and My401kPro.