5 Chart Reasons For A Bounce In Oil Stocks
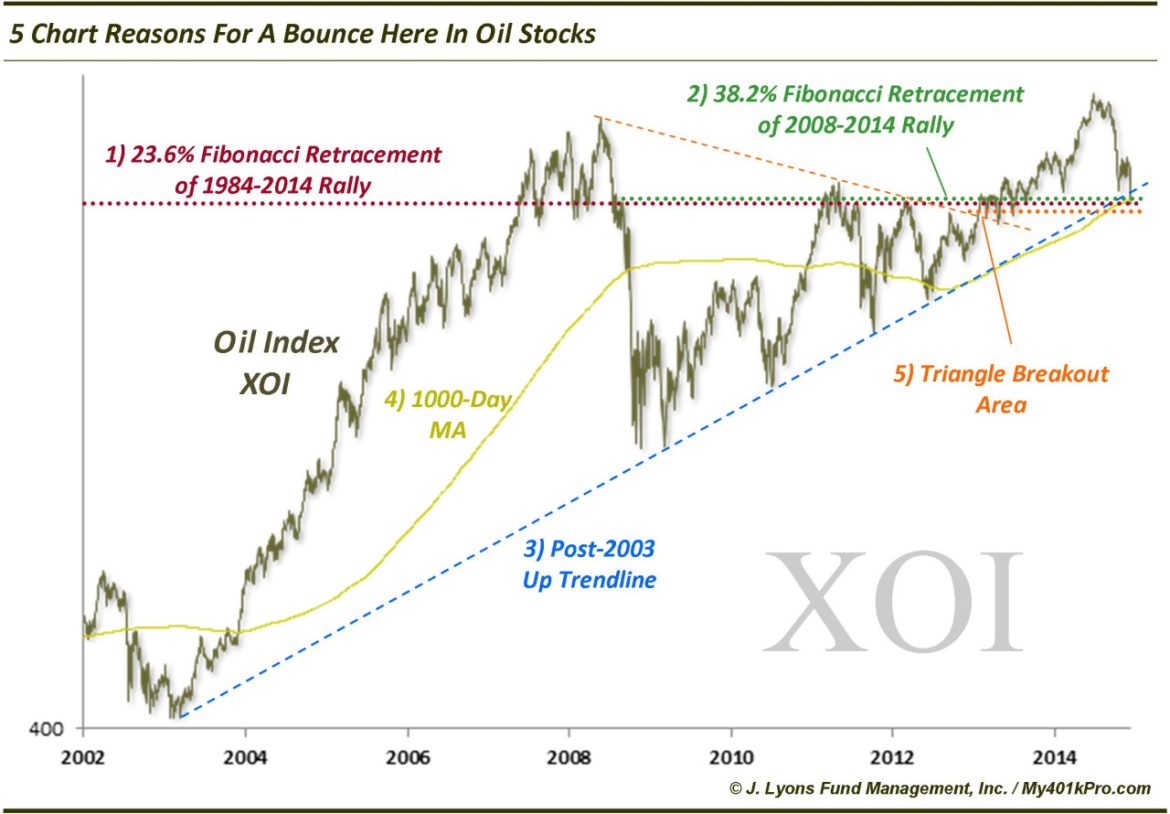
Earlier today, we put up a post revealing that total assets in Rydex energy sector funds have dropped to a new low since the bull market in energy stocks kicked off in 2003. As we showed, the extremely low level of assets has historically been a good contrary buy signal for an intermediate-term rally. However, when trying to catch a falling knife, it helps greatly if prices are at significant long-term potential support. In this case, oil stocks, as represented by the XOI Oil Index is at a level representing a confluence of 5 significant potential support factors:
- The 23.6% Fibonacci Retracement of the move from the XOI’s inception in 1984 to the high in 2014
- The 38.2% Fibonacci Retracement of the move from the 2008 low to the high in 2014
- The post-2003 up trendline, connecting the lows in 2009, 2010, 2011 and 2012
- The 1000-day simple moving average (approx. 200-week)
- The approximate level of the XOI’s triangle breakout in 2013
Obviously none of these factors, even in combination, guarantee a bounce from here. However, it is a compelling case for at least a bounce, especially considering the dried-up fund assets and with oil hitting long-term potential support.
______
Read more from Dana Lyons, JLFMI and My401kPro.