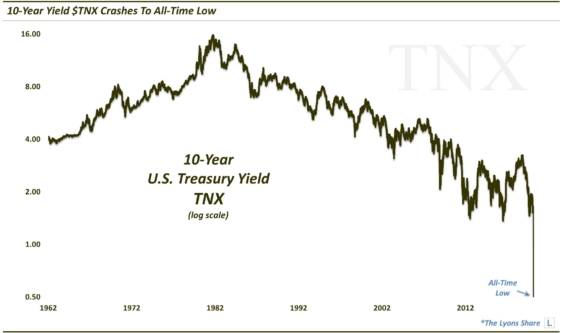
Charts Point To Further Drop In Yields
A year ago as we entered 2014, 30-Year Treasury Yields were threatening the 4% level. And despite the fact that all 67 economists in a Bloomberg survey at the time expected rates to rise in 2014, there were significant markers of resistance on the 30-Year Yield chart (as we pointed out a year ago), not the least of which was the 25-year old down trendline. Well, much to the chagrin of all 67 economists, we enter 2015 with Yields about 35% below levels of a year ago – and moving lower as we type.
On October 15, Bond Yields came crashing lower on an intraday basis, with the 30-Year dropping from 2.96% all the way down to 2.67% before closing at 2.88%. On the week, Yields dropped over 10% at one point before reversing to actually close up on the week. This had many market observers discussing the notion of a “hammer” bottom being put in. As we posted on October 3 regarding the S&P 500, while these reversal hammers are at times good signals of an impending trend change higher, they have historically been inconsistent. Indeed, we noted in a November 5 post about bond yields hitting “make or break” resistance that such hammers have not historically been indicators of a bottom in 30-Year Yields. We wrote:
“we discovered just 3 other such instances in the 30-Year Yield since 1985 in which the yield dropped more than 10% during the week only to close the week close to positive. None of those 3 marked a significant low. In fact, by 3 months later, bond yields were an average of 114 basis points lower than the reversal/hammer date.”
Sure enough, the 30-Year Yield is not only below the close of that October 15 date, it is breaking below the low of that day as well.
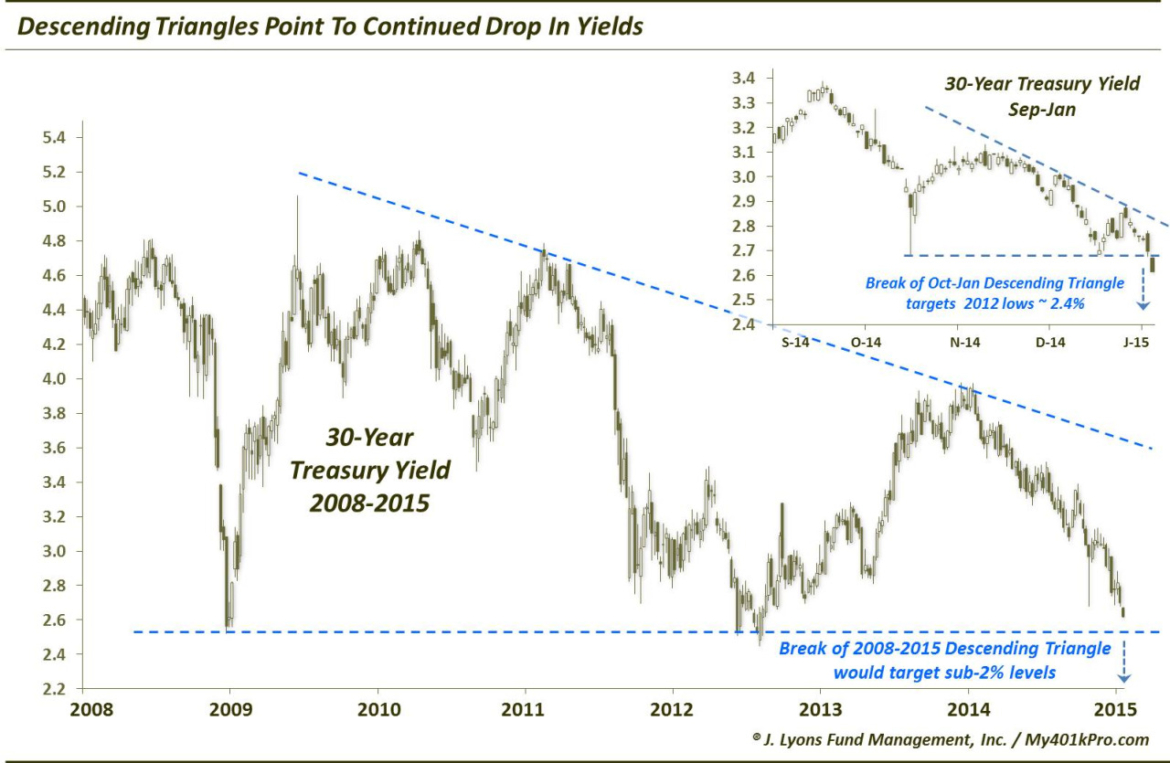
Since that October 15 date, Yields have formed what’s known as a descending triangle on the chart. It’s really just a fancy way of saying it’s made lower highs and horizontal lows. This pattern is an indication that sellers are more eager than buyers. Thus, these patterns typically result in a break of the lower support. That is happening today as Yields are breaking the 2.67-2.68 level that they held on October 15 and December 16. A break of this level, based on a measurement of the triangle targets an area around 2.40%, which happens to signify the approximate all-time low in Yields set in 2012.
Should Yields drop to that level, they will continue the formation of yet another descending triangle on a longer-term scale. This pattern has the 2008 lows around 2.50% and the 2012 lows as its base along with lower highs since mid-2009. We are getting ahead of ourselves a bit, but should Yields continue down to the 2.40-2.50% level, this descending triangle would still be intact. This would suggest an eventual break of the pattern lower. Based on measurements of the triangle, the eventual target would be well below the 2% level.
Again, we are getting a bit ahead of ourselves here with talk of a 1-handle on the 30-Year Yield. However, based on the descending triangle pattern, we should not be surprised that Yields are dropping to new lows now. Thus, eventually, we should not be surprised should Yields make new all-time lows and drop below 2%. Even if nearly all of the economists are still looking for higher rates.
________
More from Dana Lyons, JLFMI and My401kPro.