Dr. Copper Positioned For Rebound…Or Collapse

Copper, they say, is the only metal with a Ph.D. Given its many industrial uses, the movement in copper prices has, at times, foreshadowed the trajectory of global economic activity. While we have found its track record in this capacity spotty, the metal still garners plenty of attention when it moves forcefully one way or the other. Therefore, all eyes are suddenly on Dr. Copper, given its 12% drop to begin the year. The decline has brought copper prices to a critical level, and potential major inflection point.
In December, copper futures broke below their 4-year low around 2.95-3.00, the bottom of a bearish descending triangle. This was a key development as the level had held touches on 4 occasions since 2011. After testing the breakdown area (unsuccessfully) in mid-December, copper losses have accelerated. Thanks to a cut in the global economic growth forecast by the World Bank (or maybe it was just the break in price support), copper has dropped about 11% over the past 2 days. The drop overnight temporarily undercut a major support level on the copper futures chart – the 61.8% Fibonacci Retracement of the 2008-2011 rally at 2.54 – by about 4% before recovering to trade right on that level now. In our view, this is the line in the sand for Dr. Copper, as it has the potential to go, and go big, in either direction from here. You might consider the metal Dr. Jekyll at the moment.

Why could copper bounce big from here?
The 61.8% level is the most consistent and most important Fibonacci level, in our experience. And given the significance of the 2008-2011 rally in the commodity as the dominant chart pattern at this time, the impact of its 61.8% level around 2.54 cannot be overstated.
Furthermore, as we looked at on Monday regarding U.S. Dollar futures, the Commitment Of Traders positioning in copper futures is at an extreme. But whereas we saw Commercial traders, considered “smart money” at major turning points, holding an all-time record short position in the dollar, they currently have a record long position in copper futures. If ever they were positioned to support a major turn higher, they are now. Even a partial unwind of those positions could produce a sizable rally.
Lastly, and anecdotally, there appears to be a groundswell of negativity toward the metal. Perhaps it is still too soon to label it extreme, but we have never seen so many people suddenly so interested in copper as we have this week…and not in a positive light. Again, this is unscientific, but once the masses become aware of a trend, it is typically in its latter stages.
So how far could copper prices rally? The potential would be unlimited but expectations should probably be tempered in the near-term given the layers of resistance above now. The first target would be the breakdown level of a week ago around 2.75, from which the sell off accelerated. That would be a 10% move. Above that would be another test of the triangle breakdown level around 2.95, 18% higher. Those levels would have to be overcome before considering any rally of a longer-term magnitude.
Why could copper collapse from here?
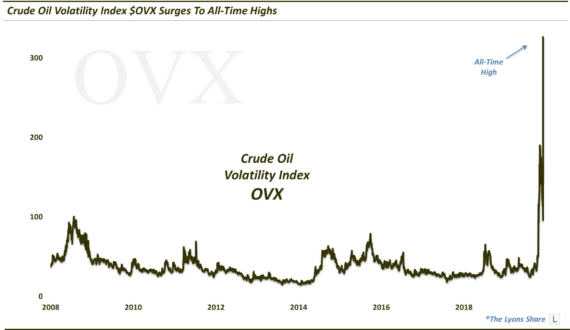
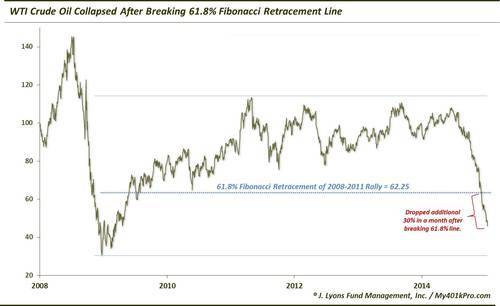
The answer is simple: if the reasons stated above fail to support copper prices at this level, the metal can fall a long way before finding any meaningful support. It is also possible that the breakdown of the descending triangle will be treated as the more important event (although it would also provide the perfect setup for a false breakdown into the 61.8% level). And for all the good reasons arguing for a bounce, they do not always lead to one, especially in a liquidity-driven event. If an oil-like liquidation unfolds, particularly possible should a meaningful equity selloff finally transpire, “support” levels will mean very little. As our president, John Lyons, likes to say, “in a bear market, support is just a 7-letter word.” Witness what happened to oil prices just recently as they sliced right through the 61.8% Fibonacci Retracement of their 2008-2011 rally. In just the month since, they have lost an additional 30%.
And what of the record long futures position by “smart money” Commercial Hedgers? Well, eventually they will be correct. However, it does not have to be tomorrow. Extremes can always get more extreme. Consider the extreme position in Crude Oil futures that we presented last July. While crude oil was not necessarily trending in the speculators’ favor at the time they built up their obscenely large position, in the short-term, these traders can capitalize on trends in their favor. Furthermore, position extremes often peak before prices turn. Therefore, the trend is first and foremost among factors determining prices.
So how low can prices go? By a measurement of the descending triangle from which prices broke last month, copper prices could drop all the way toward their 2008 low around 1.25, so that would be a 50% haircut from here. The best chance at a level supporting prices before that would be around 2.00. That would signify both a 61.8% Fibonacci Projection from the descending triangle as well as the 78.6% Fibonacci Retracement of the 2008-2011 rally. That would be a 20% decline. Based on the behavior of crude oil, should the 2.50-ish level fail to hold in copper, the 2.00 level could come in a hurry.
Lastly, we’re getting ahead of ourselves, but should prices drop back to the 2008 lows, it would seriously question the commodity secular bull market thesis. At that point, prices would have failed to make a higher low and a lower high in 2011 would be confirmed. Longer-term deflationary fears would (rightly) come into focus in such an event, if they are not already.
So what’s the bottom line. We like to keep the decision-making criteria objective and simple. The 2.50-ish level is the line on the sand for copper. If it holds above, it is bullish and the metal has a chance to move higher, though it will have plenty of overhead resistance to contend with. Also, should prices break that level only to quickly reverse back above, it (failed breakdown) would be just as bullish a scenario. If prices drop below the 2.50-ish level, then it could be katy-bar-the-door, especially if it mimics the action we saw in crude after it broke. The deflationary fears as well as global growth fears will intensify in that event.
Which will it be? Only the market knows, and only the market pays. While the (down) trend is your friend at the moment, watch that key price level. A move either way could be substantial by Dr. Jekyll, er, Copper.
________
More from Dana Lyons, JLFMI and My401kPro.