Indian Stocks May Be In For Breather After Banner Year

Almost 1 year ago, we issued a Chart Of The Day on India’s main stock index, the S&P BSE Sensex. After topping out near the 21,000 level in 2008 and 2010, the Sensex returned to that level in late 2013 and early 2014. In the post-2008 process, the index formed arguably an ascending triangle or perhaps a variant cup-and-handle formation (or maybe even some alternate pattern). Either way, the pattern was a bullish one in that it was setting parallel highs, yet higher lows. This combination typically resolves itself to the upside and indeed the Sensex broke out to new highs in early March 2014 (incidentally, we have posted recently regarding similar chart patterns involving Asian Tiger Cubs Indonesia, Thailand and the Philippines).
Aided by a favorable election of a pro-business prime minister a few months afterward (at least that was the popular narrative), the BSE Sensex never looked back following its breakout. The only better breakouts than those that test the breakout point and immediately bounce are those that never even test that breakout point. They just run immediately, refusing to offer those who missed the breakout a discounted entry point. This was the case over the past year with the Indian stock market. From the breakout point to its recent high, the Sensex has rallied as much as 42%, earning our equity market of the year award for 2014.
Another key characteristic of the breakout over the past year is that it has validated the hypothesis that a secular bull market began in the Indian market in 2003. The new high above the 2008 and 2010 levels suggests that perhaps over the remainder of the decade or so, the market should be able to continue to make new sustainable highs. That said, no market goes straight up forever (notwithstanding U.S. stocks over the past 2 years). And just recently, the BSE Sensex Index has entered a zone that we identified as a possible first area of resistance.
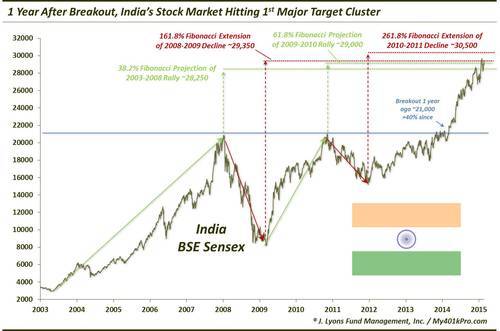
The rationale behind potential resistance near here is a cluster of key Fibonacci measurements stemming from the index’s price patterns from 2003 to 2014. The close proximity of each of these levels reinforces confidence in their potential impact. Specifically, the levels stem from the following analyses, as laid out on the chart:
- 38.2% Fibonacci Projection of 2003-2008 Rally ~28,250
- 61.8% Fibonacci Projection of 2009-2010 Rally ~29,000
- 161.8% Fibonacci Extension of 2008-2009 Decline ~29,350
- 261.8% Fibonacci Extension of 2010-2011 Decline ~30,500
By no means are we putting the nail in the coffin on the Indian rally. To the contrary, we don’t think the significance of the breakout of a year ago can be overstated. It is our view that it validated the presence of a secular bull market in Indian stocks. We are simply saying that, particularly given the close proximity of the 4 key Fibonacci resistance levels, the nearby area may present a challenge for the market in the intermediate-term. Whether that means taking profits, putting off adding new exposure, selling some option premium, etc. is up to each individual. We would not be surprised though to see the Indian stock market take a bit of a breather near here within its very bright longer-term picture.
________
“Jai Hind” photo by Cajetan Barretto.
More from Dana Lyons, JLFMI and My401kPro.