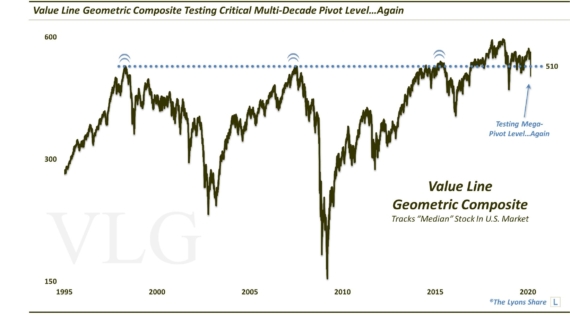
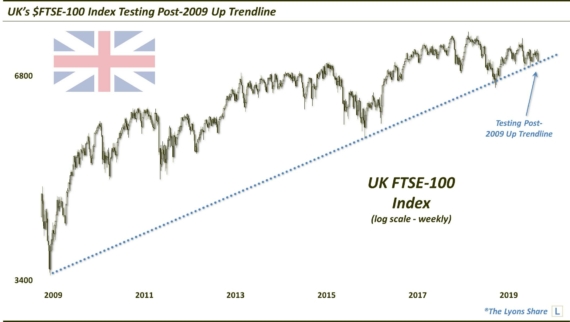
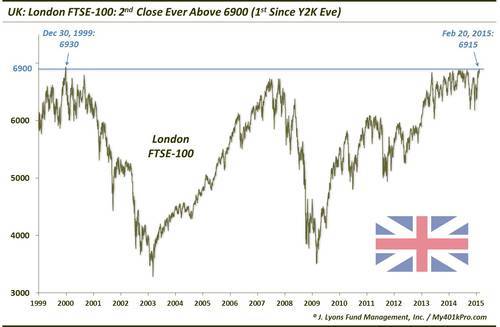
UK’s FTSE-100 Ascends Above 6900 For 1st Time Since Y2K
Over the past 2 years, there has perhaps been no trickier equity index worldwide than the London FTSE-100. After topping out at the same proximate level in 1999 and 2007, the index returned to that level again in May 2013. And after a pullback, the index returned again to the level, seemingly poised to break out to a new all-time high. Yet, it pulled back again, before bouncing again, before pulling back again, before…you get the picture. The index has been bouncing up and down like a yo yo for the past 2 years, and not just in a tight range. The FTSE has pulled so many head fakes on seemingly “significant” moves, it has had market technicians’ heads spinning. For example, during that 2-year span, the S&P 500 has crossed above or below its 200-day moving average just 2 times. The FTSE meanwhile has crossed its 200-day moving average no less than 36 times during that period.
Due to its schizophrenic behavior, we have written both a bullish and a bearish leaning post on the FTSE during this time. And while neither post has been refuted, neither has been validated either. The bullish post from September 3 of last year, suggested the index appeared poised once again to overtake its former high. That all-time high was set on the last trading day of the previous millennium, December 30, 1999, at 6930. In the September post, we recommended waiting for the 6900 level to be breached first before considering it a breakout. This was sound advice as the index literally spent only a few minutes above 6900 on September 4 before failing yet again at the level.
After 4 swings of 8% or more over the past 5 months, on Friday the FTSE-100 did finally close above 6900 for only the second time ever – and the first time since the eve of Y2K.
Will this be another fake out? Or does the index have a legitimate shot at finally breaking above its all-time highs set 15 years ago? At the risk getting juked again, we think the index does still have a shot at all-time highs. As with the Value Line Geometric Composite we mentioned in a post last Friday, the FTSE’s recent foray to its highs has been of a different character than those in 1999-2000 and 2007.
Unlike those previous trips which were rejected in fairly short order, the FTSE has been bouncing off the 6800-6900 ceiling for nearly 2 years now. It is said, and we would concur, that the more times a level is tested, the more likely it is to eventually break, at least temporarily. The fact that the index is still hanging around this level after 2 years suggests it will eventually break through. It is like a helium-filled balloon bouncing off an open ceiling. Eventually it will find that opening and ascend to new heights.
Assuming the FTSE is able to make a new high, what kind of elevation could it see? We covered some potential “targets” in the September 3 post that we will repeat. I will reiterate that we are not big fans of “targets”. We prefer to take what the index gives us (for better or worse) without a preconceived bias toward what it “should” do. These targets, however, are simply measurements of potential price moves based on existing price patterns. For the FTSE, these are some potential destinations, given a breakout:
- Approximately the 7750 level (+12% gain) represents a measured move from the 2013-2015 trading range, as well as the the 61.8% Fibonacci Projection of the 2009-2011 rally and 38.2% Fibonacci Projection of the 2011-2013 rally.
- Approximately the 8250 level (+20% gain) represents the 261.8% Fibonacci Extension of both the 2011 decline and 2013/2014 declines AND the 61.8% Fibonacci Projection of 2011-2013 rally.
- Approximately the 8750 level (+30% gain) represents the 161% Fibonacci Extension based on 2007-2009 decline and the 100% Fibonacci Projection based on 2009-2011 rally.
These targets are assuming a FTSE breakout. And while the index appears as though it should break out eventually, you know what they say about when you assume something. Therefore, it is always recommended practice to wait for a breakout to occur rather than anticipating it. That certainly would seem like sound advice as it pertains to the FTSE, given its antics the past 2 years. Doing so may help insure that, as The Who stated, we won’t get fooled again.
____
Read more from Dana Lyons, JLFMI and My401kPro.