A Glimmer of Hope for Oil Bulls

On March 13, we posted a piece on the divergence between the Euro and the Euro Volatility Index (EVZ). The EVZ (like most volatility indexes) typically rises as the underlying asset falls. In this case, as the Euro was breaking below its January low, the EVZ failed to make a higher high. As we pointed out, similar divergences had occurred at other significant lows over the previous 7 years. And while it is too soon to make a call in the present case, the recent rally in the Euro suggests at least the potential for a repeat of that.
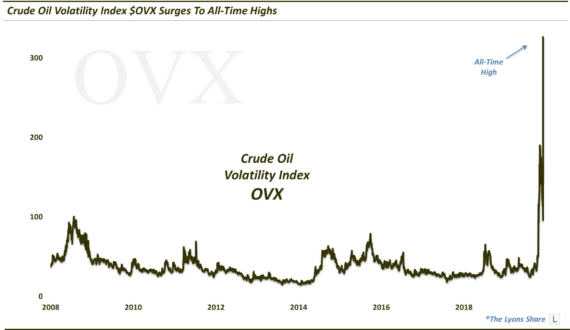
Switching focus to the other high-profile market that has been similarly decimated over the past 9 months – oil – we are seeing a similar situation. With oil prices breaking their January lows last week, the action in the Oil Volatility Index (OVX) was interesting in that it did not make a higher high. (related post: This Indicator Says Don’t Believe Recent Oil Rally [Feb 4]). Specifically, this chart shows the United States Oil ETF (USO), an oil proxy off of which the OVX is based. It made a new low last week while the OVX had not made a new high (and still has not).
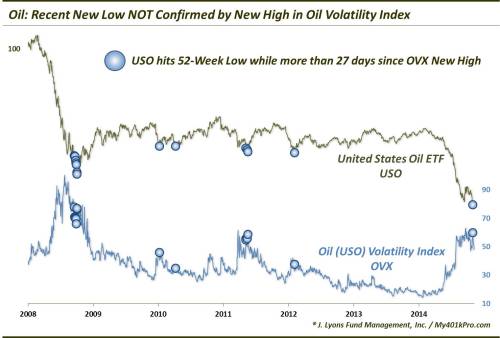
As may be gleaned from the chart, like the Euro/EVZ, similar divergences between the USO and the OVX have occurred at key lows over the past 7 years. Such dates include February 2009, August 2010, October 2011 and June 2012.
Not surprisingly, the performance in oil prices has been extremely positive following these divergences. There have been 15 prior days on which the USO made a 52-week low yet the OVX had not made a 52-week high in at least 27 days. All 15 instances saw the USO higher 2 months, 6 months and 12 months later. The peak median return was at the 6-month mark, at +33.5%.
Now there were several clusters of these days, in 2008 and 2011. Using only the initial occurrence of the USO/OVX divergence, we get 4 dates before our current instance. Here is the performance of the USO following those 4.
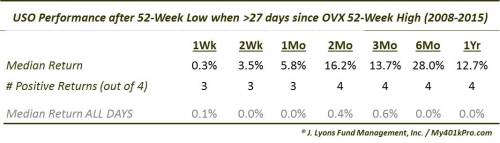
Obviously, this has been an almost unanimously bullish scenario over all time frames from 1 week to 1 year (the one instance that was negative from 1 week to 1 month was in 2009 as the crash was nearing completion.) And while it is just a small sample size, that is what one would expect given the nature of the conditions.
So is this phenomenon merely a fluke or is there a rationale behind it? Well, volatility indexes are by definition a measure of volatility “expectations”. And if declining prices normally equate to volatility, the end of falling prices would suggest lower volatility “expectations”. Thus, it makes sense that volatility indexes cease to expand if the expectations for an end to the declines is at hand. OF COURSE, the big question is whether or not the volatility indexes are correct in flagging lower volatility expectations at such junctures.
At least in terms of the oil market, such volatility divergences have been consistently accurate in signaling bottoms in oil over the past 8 years. We don’t have a crystal ball so we don’t know if the current instance will produce similarly positive results. However, this is finally at least one statistically-based glimmer of hope for oil bulls.
__________
“The Burning of the Sky” photo by Justin Vidamo.
More from Dana Lyons, JLFMI and My401kPro.
The commentary included in this blog is provided for informational purposes only. It does not constitute a recommendation to invest in any specific investment product or service. Proper due diligence should be performed before investing in any investment vehicle. There is a risk of loss involved in all investments.