Economically Key Industrial Metals Space Hanging On Precipice

The theme of many of our posts and Charts Of The Day during this 1st quarter has revolved around the “D-Word”: Deflation. Whether it’s financial measures, like interest rates, inflation expectations, shipping rates, etc., or commodity prices like oil, copper or composite gauges like the CRB Index, the message has been the same: prices are falling. It’s one thing if prices are falling due to a ramp in productivity and global economic efficiencies, however one would have a difficult time making that argument in the present circumstances. Rather, these deflationary pressures are likely a warning regarding the strength, or lack thereof, of the global economy. Today, we point out yet another potential deflationary warning sign: this one from the economically sensitive industrial metals space.
It makes sense that pricing of industrial metals (like aluminum, copper, nickel, zinc, etc.) would make for a decent barometer of economic strength. These metals go into the manufacturing of a myriad of products. Thus, their pricing, i.e., a sign of the level of demand for these metals, is a tip off to the level of global economic demand present. Using a composite index of these metals prices, we see how depressed this area has been of late. Furthermore, we see how vulnerable the space is to a further drop in prices.
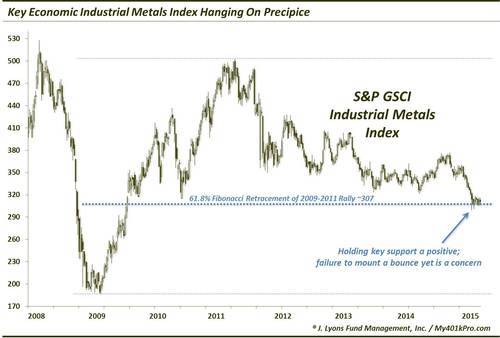
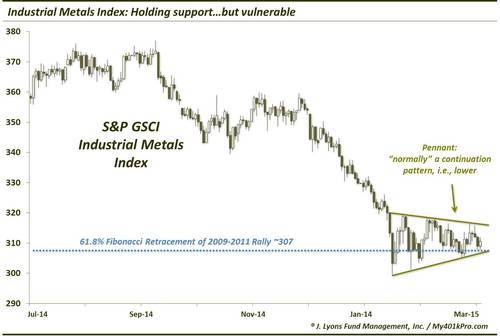
As the chart shows, the S&P GSCI Industrial Metals Index is sitting just at the 61.8% Fibonacci Retracement of its 2009-2011 rally around 307. This is following an approximate 25% drop since September. The fact that it held this key level is certainly important. As long as it remains above this area, the benefit of the doubt should be given to the upside.
That said, there is ample reason to be concerned about an eventual resumption in its downward trajectory. After first hitting 307 on January 14, the index has been able to maintain the level. However, it is telling that it has not been able to mount anything but a very feeble bounce since. In fact, the highest the index has bounced was to 319, 4 days following the initial low. It has essentially been moving sideways since, forming lower highs and higher lows.
At this point, the price behavior has the looks of a continuation pattern. That is, once it is finished, the index should continue in the direction of its previous trend, i.e., down. The rationale behind that interpretation is the feeble bounce, given a 25% drop. It should have been able to rally beyond what it has thus far, if there were to be an impending reversal. Additionally, the lower highs and higher lows have carved out what’s called a “pennant” formation. More times than not, this type of chart formation is resolved in the direction of the prior trend, again down. Here’s a closer look at the developing pattern.
This pennant formation should resolve itself within a few weeks. If the resolution is lower, it means a likely new leg down in the S&P GSCI Industrial Metals Index. It will also suggest that the D-Word, which has been the prevalent theme of the past 3-6 months, is still in force. That would not be good news for the global economic picture.
________
“industrial steel pattern” photo by Cesar Gonzalez.
More from Dana Lyons, JLFMI and My401kPro.
The commentary included in this blog is provided for informational purposes only. It does not constitute a recommendation to invest in any specific investment product or service. Proper due diligence should be performed before investing in any investment vehicle. There is a risk of loss involved in all investments.