Setup In Place For Possible Euro Bottom
One thing that I’ve learned over the years (sometimes the hard way) is to resist the urge to catch a falling knife. By that, of course, I am referring to a market that is in a precipitous decline. As my father likes to say, “support is just a 7-letter word in a bear market”. Thus, our modus operandi is to stick to buying things that are in an uptrend. The one (and only) exception to this rule for us is if an asset has fallen to a MAJOR long-term level of significance. I know this sounds contradictory, but I am talking about less than a handful of levels on a long-term chart that might be deemed to have major significance. And while this maneuver carries risk, the reward, if one is adept at identifying the appropriate levels, should be many multiples greater than the risk. We have posted such examples in real-time over the past 12 months. While they did not all work out (e.g., oil), several did, including the Biotech Index, the Russell 2000, the Dubai Stock Market and the MSCI EAFE. In our view, one can add the Euro to that list of falling knives potentially hitting a key support level.
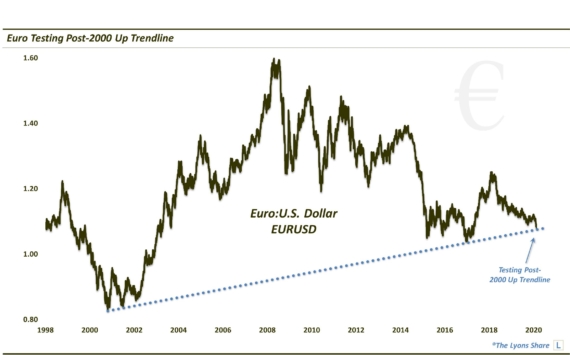
Folks in the investment community, ourselves included, have been taking turns since last summer calling (incorrectly) for a bottom in the Euro currency. We took a stab last August at identifying possible support for the Euro around 130.50 on the FXE ETF, or about 132.50 on the EuroDollar. Needless to say, that level was sliced through like hot butter and we have not seen cause for any optimism in the currency since…until now. As the Euro is making fresh 12-year lows as I write, what is our rationale behind this thesis? Let’s look at the chart.
Since the inception of the Euro currency in 1997, the low point in the Euro versus the U.S. Dollar was around 0.82 in 2000. Obviously, that would be one of the MAJOR potential support levels on the long-term Euro chart. What other level might be considered potential major support? Given the limited history of the currency, in our view there are not too many others. Certainly 1.00, or “par” with the Dollar, is another major psychological level.
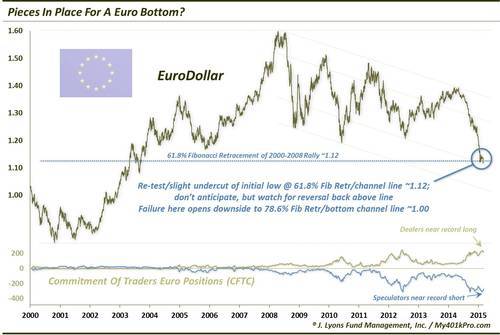
Technically speaking, though, there is probably just one other level that would rank ahead of par in terms of significance. You have probably seen us mention Fibonacci levels on many occasions. If so, you probably know that the most significant Fibonacci level is 61.8%, called the Golden Ratio. Looking at the Euro, its all-time high occurred in 2008 right about at 1.60. Measuring a 61.8% Fibonacci Retracement of the 2000-2008 rally from 0.82 to 1.60 yields 1.12. This happened to be the post-2008 low close on January 23.
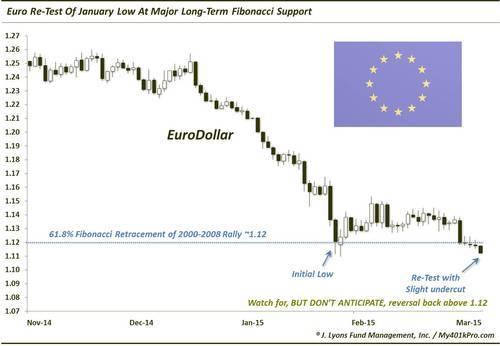
Wait, didn’t I mention that the Euro is now breaking to new lows for the decline? Indeed it is. However, this is how bottoms have traditionally been forged. With all apologies to the plethora of V-Bottoms in the equity market over the past 2 years, prices have historically undergone a bottoming “process” rather than a bottom “point”. The process has traditionally included an initial low, e.g., January 23 in the Euro, followed by a bounce before prices fall again to “test” or “retest” the initial low. It is not uncommon in such a retest for prices to briefly undercut the initial low before embarking on a sustainable rally. The undercut actually removes leftover “weak hands” being stopped out on a move below the previous lows. This removal of supply is what aids in the possibility of a durable rally. That is what is unfolding now. Here is a closer look.
Let me take this moment to clearly state the following:
The potential Euro bottom is triggered ONLY IF PRICE REVERSES BACK ABOVE 1.12.
With the Euro now printing below 1.11, is the bottom potential negated? No. As mentioned, it is not unusual, nor unwelcomed, for price to undercut the initial low before reversing. So how long of a leash do we give this undercut, and how much time? Generally, the reversal should happen quickly, i.e., within days or weeks, at the most. Should price continue to drop from here without any bounce, the potential setup can be considered a failure. Remember, only a move back above the 1.12 level would trigger a bottom potential in our view.
This bottom potential has a few other things going for it. As shown in the first chart, the Euro is also now hitting an inner channel trendline, parallel to the outer trendlines defining the downtrend since 2008. Though not as significant as the bottom channel line, this inner line has provided support to the Euro in the past, most notably in 2012.
Additionally, also shown in the first chart, the level of net long positioning in Euro futures on the part of dealers is near an all-time record (according to the CFTC’s Commitment Of Traders report). These entities have historically been on the correct side of markets at major turning points. The obvious caveat is that they have been at a near record long position since last summer, to no avail. So perhaps this is not a catalyst for a bottom here. However, should one form, or begin to form, it could be an influential driver in whatever rally transpires.
Should the Euro fail to recover the 1.12 level in fairly short order, we would abandoned thoughts of the current setup being part of a potential bottoming process. In that event, the next level of significance to the downside would probably be near the par level of 1.00. Not only is this a psychological level as we mentioned, but it also represents the current confluence of the bottom channel line as well as the 78.6% Fibonacci Retracement of the 2000-2008 rally.
Time will tell if the Euro is able to form a bottom here – and it will likely tell soon. As we laid out, there are compelling factors in place now (e.g., the Golden Fibonacci line, the channel line, the COT dealer long positioning and the developing “re-test” pattern) that could support, at least an intermediate-term bottom, if not longer. The key to focus on, in our view, is the 1.12 level. Should prices reverse and the Euro recover that level, a bullish scenario can unfold. If not, this knife will keep falling.
________
“50 Euros going down the drain” photo by Images Money.
More from Dana Lyons, JLFMI and My401kPro.
The commentary included in this blog is provided for informational purposes only. It does not constitute a recommendation to invest in any specific investment product or service. Proper due diligence should be performed before investing in any investment vehicle. There is a risk of loss involved in all investments.