World’s 2nd Largest Stock Testing Historic Trendline

We don’t often discuss individual stocks, either in our practice or in these pages. So when we dedicate our Chart Of The Day to a stock it has to be a biggie – like Exxon Mobil (XOM), the 2nd largest stock in the world. Likewise, we do not often discuss trendlines, or at least we do not often make them the focus of a chart. Therefore, when we do highlight one, it too has to be a biggie – like Exxon Mobil’s trendline dating back to the 1987 crash. We are highlighting it today as the stock is presently in the process of testing the 27.5-year old trendline. This chart shows monthly bars in XOM back to 1987 plotted on a logarithmic scale.

As I said, we don’t mention trendlines too often in our analysis. We don’t necessarily have anything against them. We just have a problem with how they are too often applied. While their beauty is in their simplicity, this simplicity also opens up the possibility for misuse. One reason is that they are very subjective. They can basically be drawn between any points anywhere on a chart that a technician sees fit. Furthermore, when one trendline is broken, it is common practice to simply re-draw the trendline to adjust to the now higher or lower prices.
One rule of thumb for us is that a trendline should connect at least 3 price points. Otherwise, they can simply be re-drawn to adjust to shifting prices. If there are 3 points attached to a trendline, it cannot be re-drawn without detaching one of the points. Therefore, when such a trendline is broken, it is meaningful. This is because the line which previously held prices on multiple occasions has failed to do so, thus marking a change of character. Furthermore, the trendline with at least 3 points of contact is rigid and therefore not subject to ambiguity or subjectivity with respect to its break.
Related to that point, another piece of advice with respect to trendlines is to be completely honest about their application. If you draw a trendline on a chart, it should be meaningful, otherwise, why draw it? Therefore, don’t redraw the thing if it breaks. If you thought it important enough to include in analyzing a chart, then respect it once it breaks.
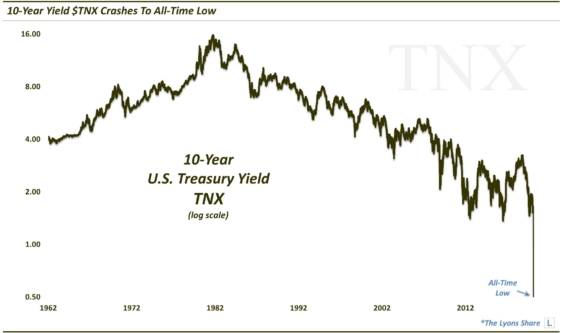
Again, we are not anti-trendline. We think it is a useful tool, even if it becomes a self-fulfilling prophesy. The more touches a trendline receives – and holds – the more eyeballs that will then be focused on that line and thus, the more important it becomes. Therefore, we do not believe they are all random, especially long-term ones. Consider the 20 or 30-year long trendlines in the Japanese Nikkei and U.S. interest rates over the past several decades. It would take quite a leap to consider those trendlines to be completely random.
That brings us back to Exxon Mobil. The low on the day of the 1987 crash, October 19, was 7.72 (split-adjusted). On a logarithmic scale, one can draw a trendline from that point connecting the lows in 1994 and 2010, nearly to the penny. What makes it noteworthy at the moment is that the stock is threatening to break down below the trendline, having tested it on at least a half dozen days in the past few weeks. Considering the duration of the trendline, a break of it could have serious ramifications.
Zooming in a little bit. we do see some cause for concern. While the oil and gas sector has certainly been washed out, the technical damage done in XOM has rendered it vulnerable here, if it cannot recapture some key lines (shown on the chart below) during any oversold bounce.
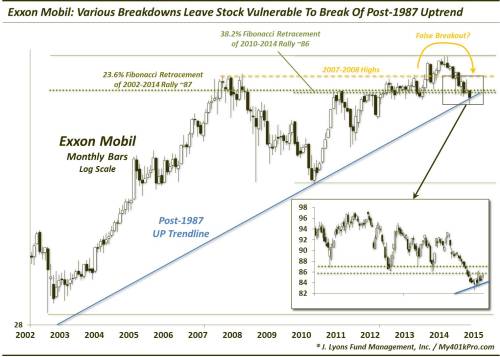
These are the factors that render XOM vulnerable to breaking the nearly 20-year old trendline:
- A failed breakout above the former 2007-2008 highs around 95 over this past year
- A break of the 38.2% Fibonacci Retracement of the 2010-2014 Rally around 86
- A break of the 23.6% Fibonacci Retracement of the 2002-2014 Rally around 87
- The inability (thus far) to create any thrust or separation off of the post-1987 trendline over the past few weeks
This historic trendline has not yet been broken, so we don’t want to anticipate it. But although Exxon Mobil has held up relatively well compared with most companies in the sector during the recent oil collapse, its chart has definitely been softened up quite a bit given the break of some key support levels. Therefore, the post-1987 trendline does seem at risk of being broken. And while a break of the decades-old trendline would be just one piece of a complicated puzzle, it wouldn’t be just an ordinary trendline being broken. Otherwise we would not bother talking about it.
The fact that it does go so far back makes it easy to argue its significance – and its potential negative impact should it be broken. Furthermore, given that Exxon Mobil has the 2nd biggest market cap in the world, any major development in its price pattern will carry a lot of weight within the major and sector averages. Therefore, while we do not invest in individual stocks, this is one that we will be monitoring.
__________
“Aleyska pipeline photo by Henrik Halen.
More from Dana Lyons, JLFMI and My401kPro.
The commentary included in this blog is provided for informational purposes only. It does not constitute a recommendation to invest in any specific investment product or service. Proper due diligence should be performed before investing in any investment vehicle. There is a risk of loss involved in all investments.