Hong Kong Stocks Finally Follow Through On July Breakout

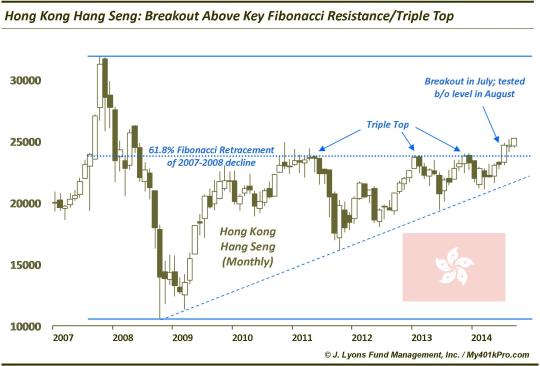
Last September, we detailed the major breakout in the Hong Kong Hang Seng Index (HSI). Specifically, the HSI broke out above a triple top near 24,000 that was formed between 2010 and 2014. The kicker was that the three tops on the monthly chart lined up perfectly at the 61.8% Fibonacci Retracement of the massive 2008-2009 decline. Here is the chart from that post:
While the breakout was compelling, it is often the case that a stock or index will “test” the breakout point before following through to the upside. The HSI has spent the past 6 months or so doing precisely that. In the process, it has arguably formed the “handle” of a cup-&-handle pattern, with the cup portion spanning from the 2010 highs to last summer’s highs. Today’s near-4% jump in the Hang Seng finally delivers the upside follow-through to the breakout that we’ve been waiting for.
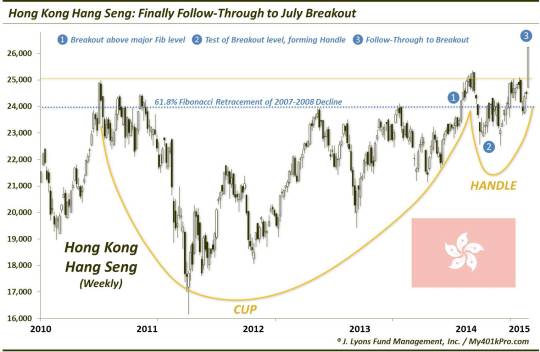
While there is no guarantee that the index will continue higher, the chart certainly provides ample and compelling evidence to that scenario. Furthermore, though every market is unique, the breakouts that we’ve highlighted in Tokyo, Shanghai and across the Tiger Cub markets offer plenty of blueprints for such follow-through. If the Hang Seng is successful in continuing higher in the near-term, an eventual run at the 2007 all-time highs near 32,000 isn’t out of the question.
________
“Sunrise over Hong Kong” photo by slack12.
More from Dana Lyons, JLFMI and My401kPro.
The commentary included in this blog is provided for informational purposes only. It does not constitute a recommendation to invest in any specific investment product or service. Proper due diligence should be performed before investing in any investment vehicle. There is a risk of loss involved in all investments.