This Indicator Has Led To 70.7% Losses 100% Of The Time

The Chart Of The Day for April 1 reveals one of the weakest historical tendencies we have ever seen. The Nasdaq Composite closed the 1st quarter yesterday at 4900.884. Since 1970, the median 3-year return when the Nasdaq has closed the 1st quarter above 4199 is minus -70.7%. Ominously, 4900.884 > 4199.
April 1, 2015 Chart Of The Day:
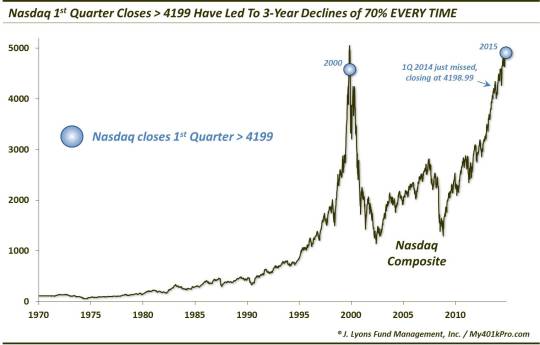
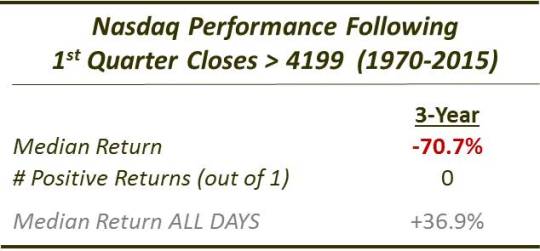
Not only is the median return of -70.7% much worse than the median 3-year return following all days since 1970 of +36.9%, but there has been tremendous consistency in weak returns following such conditions. In fact, the 3-year return has been negative every time the Nasdaq closed the 1st quarter above 4199.
Table accompanying the Chart Of The Day for April 1:
These are the years in which the Nasdaq closed the 1st quarter above 4199: 2000, 2015. Interestingly, 2014 narrowly missed our criteria, closing the 1st quarter at 4198.99.
There is no guarantee that the Nasdaq will be down 70.7% in 3 years. However, it has been every single time in history following the conditions laid out in our Chart Of The Day for April 1.
________
Photo at top by unknown, depicting the moving scene from Saved By The Bell in which Jesse Spano (played by Elizabeth Berkley, Oscar nominee for Best Actress for her role in Showgirls), was hooked on caffeine pills and freaked out while singing the Pointer Sisters’ “I’m So Excited”.
More from Dana Lyons, JLFMI and My401kPro.
The commentary included in this blog is provided for informational purposes only. Today’s commentary, in fact, is an April Fool’s parody. Please don’t make any investment moves predicated on the Nasdaq being down 70.7% in 3 years. It does not constitute a recommendation to invest in any specific investment product or service. Proper due diligence should be performed before investing in any investment vehicle. There is a risk of loss involved in all investments.