Dr. Copper: Rebound Diagnosis Was Correct…What’s Next?
Resolution at 2.95 may shape the inflation/deflation debate
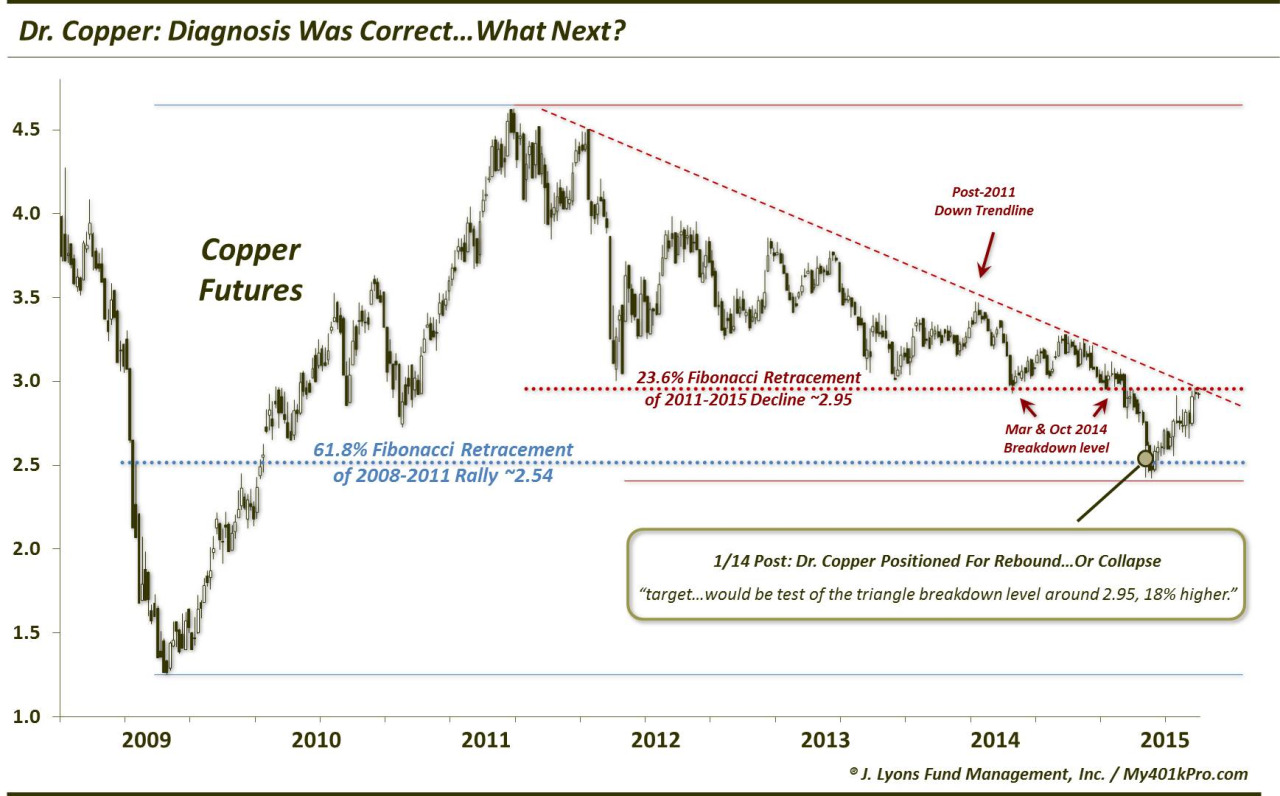
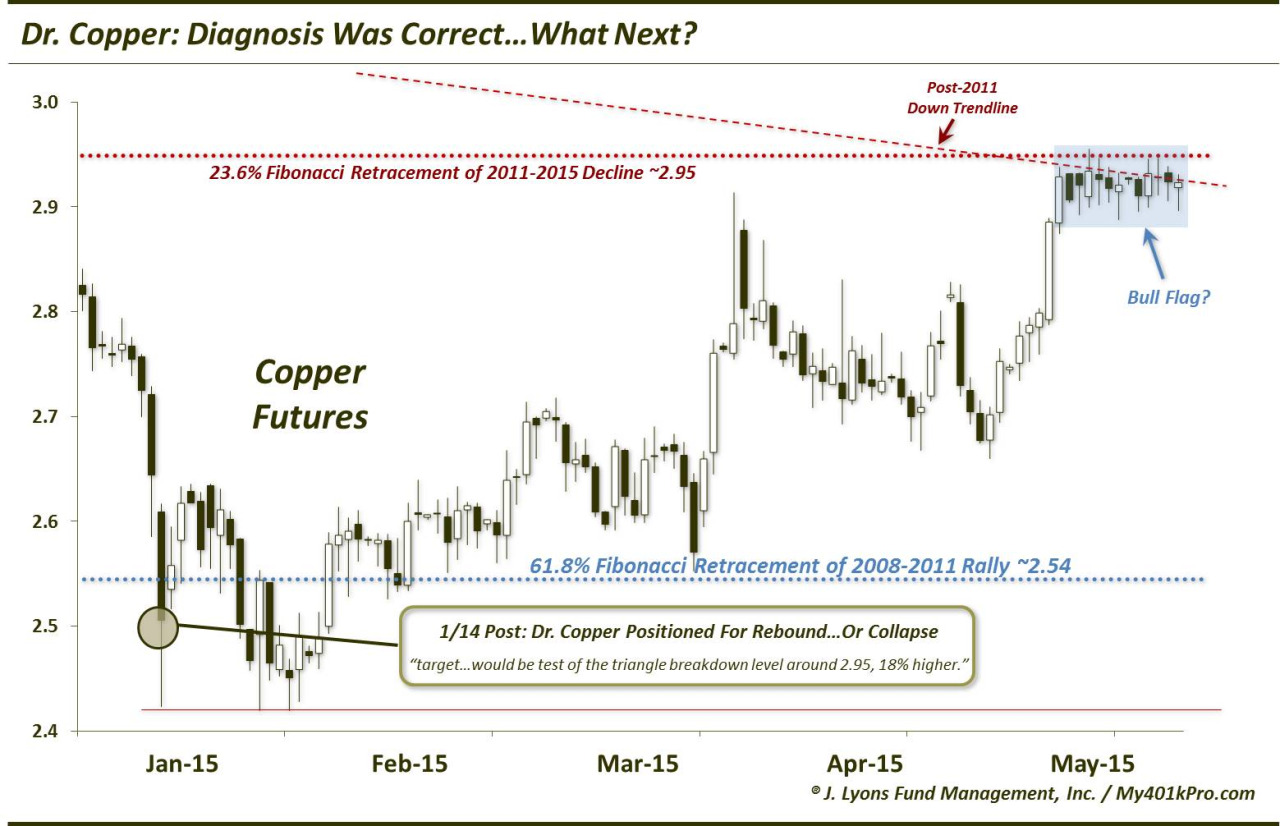
On January 14, we wrote a post titled “Dr. Copper Positioned For Rebound…Or Collapse”. At the very moment, copper was in full-on crash mode, down over 20% in the previous 5 weeks and down, at one point, more than 8% on the day. The metal was the latest poster child of the deflationary forces taking grip around the world at the time. It also struck us that perhaps “Dr. Copper” (so named for its reputation as a barometer of economic growth) was receiving a bit too much attention and possibly due for a turnaround. As we wrote at the time:
“…anecdotally, there appears to be a groundswell of negativity toward the metal. Perhaps it is still too soon to label it extreme, but we have never seen so many people suddenly so interested in copper as we have this week…and not in a positive light. Again, this is unscientific, but once the masses become aware of a trend, it is typically in its latter stages.”
More objectively, and more importantly, we noted that copper’s crash had brought its price to a very key long-term potential support level, the 61.8% Fibonacci Retracement of the 2008-2011 rally at 2.54. And as we wrote:
“The 61.8% level is the most consistent and most important Fibonacci level, in our experience. And given the significance of the 2008-2011 rally in the commodity as the dominant chart pattern at this time, the impact of its 61.8% level around 2.54 cannot be overstated.”
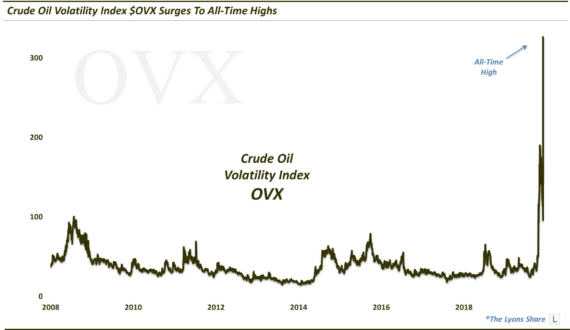
To the “collapse” point, we also noted how other commodities, including copper’s economically important brother, oil, had sliced right through their own Fibonacci lines during the deflationary meltdown. Thus, copper could potentially fall much more, if the deflationary spiral continued. Therefore, we concluded the 2.54 Fibonacci level:
“…is the line in the sand for Dr. Copper, as it has the potential to go, and go big, in either direction from here.”
Well, copper did rebound from that level, after a brief undercut and recovery (a bullish scenario we also noted as a possibility.) The subsequent bounce has taken the metal up about 20% off its lows. It has also taken it to the key target we outlined in the January post at 2.95. 2.95 represents major resistance for the metal in the form of these significant levels (as shown on the charts above):
- the breakdown level of the March and October 2014 lows
- the 23.6% Fibonacci Retracement level of the 2011-2015 decline
- the post-2011 down trendline
The significance of these analyses on their own, and especially in concert, is obvious. Furthering confidence in their significance is the fact that after first reaching the 2.95 level, copper has traded on that level, without breaking out, for 13 straight days.
In our view, this 2.95 level is key, not just in the near-term movement in copper, but also as representative of the inflationary vs. deflationary debate. Below there, deflation could remain the dominant force. Above that level, copper has a chance to move higher, and perhaps a lot higher. That could also signify that the worst of the deflation scare is behind us.
Of course, going hand in hand in this theme is the movement of the U.S. Dollar. As we first noted on April 24, the Dollar has finally shown some weakness following its massive run up over the past year. Should it continue to drop, it will provide a further boost to commodities like copper. If, however, it resumes its longer-term uptrend, it will be a headwind for commodities and inflation.
One potential chart pattern suggesting that copper may break through the 2.95 level is a possible “bull flag” in the short-term. As noted, copper prices have consolidated at the 2.95 level, without yet breaking out. The fact that it has held up well, however, after its rally from 2.50 is a good sign. This is in contrast to the Oil Services chart we posted on May 12, in which prices were emphatically rejected at resistance, suggesting a tougher road to hoe. In this case, the potential bull flag suggests copper has a chance to eventually break above there.
If it is successful in surpassing 2.95, the next longer-term target for copper may be around 3.27. This level is represented by the 38.2% Fibonacci Retracement of the 2011-2015 decline as well as the July 2014 highs, from which last year’s decline got started. It would also get copper above the long-term post-2011 down trendline. And, as mentioned, perhaps it will signify an end of the worst of the deflationary pressures. That is, if Dr. Copper really does have a Ph.D in economics.
___________________
More from Dana Lyons, JLFMI and My401kPro.
The commentary included in this blog is provided for informational purposes only. It does not constitute a recommendation to invest in any specific investment product or service. Proper due diligence should be performed before investing in any investment vehicle. There is a risk of loss involved in all investments.