Biotech Sector: Support Levels To Watch
No sector has exemplified these past few years of the cyclical bull market as much as biotechnology stocks. Likewise, no sector has garnered as much attention in terms of speculating on its potential demise as the biotechs have. Therefore, given the immense interest in the space, we thought we’d share some chart levels on the headline NYSE ARCA Biotechnology Index (BTK) that we view as most significant. Additionally, there are a few reasons why this chart is both an instructional one to share as well as one in which we have a good deal of confidence in terms of our read of it.
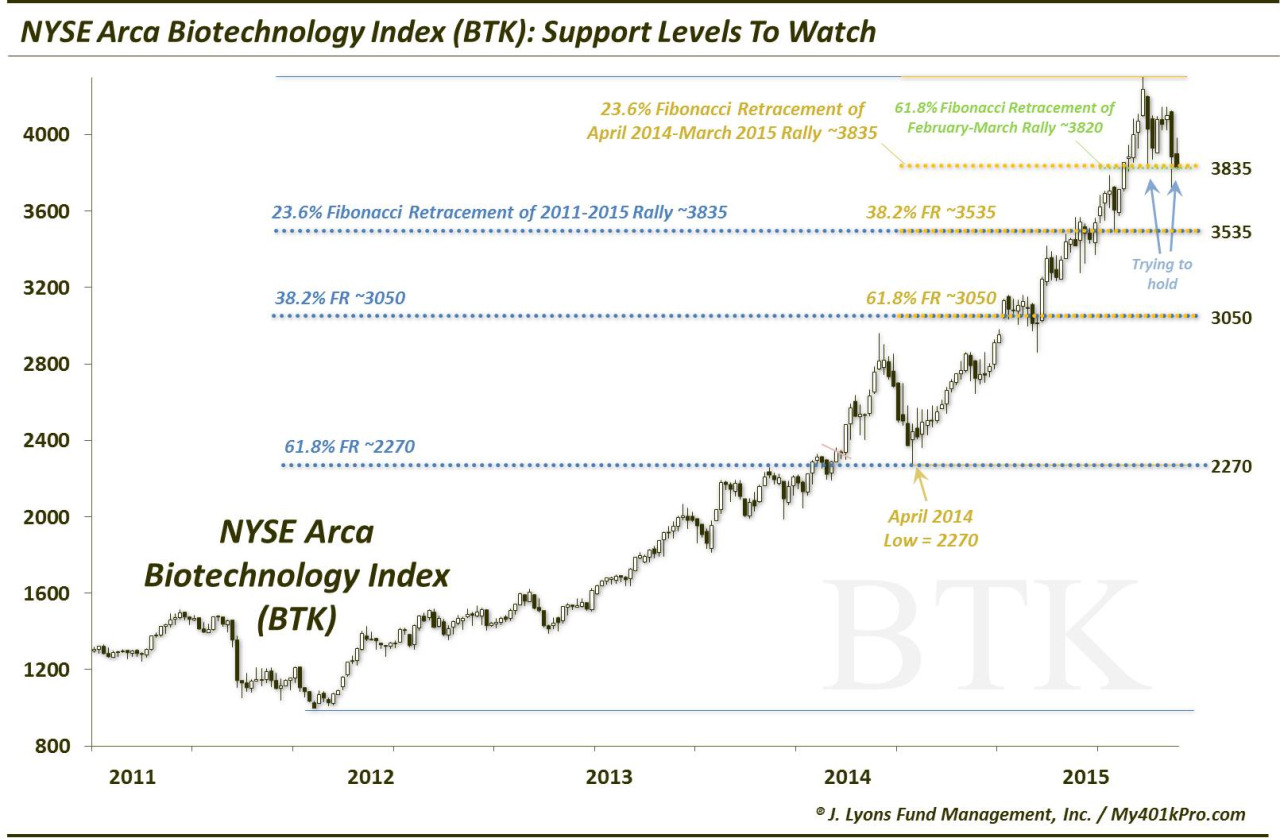
As you can see from the first chart, we are focusing on Fibonacci Retracement levels in our analysis. When we apply them, we favor calculating the Retracements between the most significant inflection points. And when trading based on these levels, we prefer to do so when there is a confluence of important Fibonacci levels within close proximity of each other. When that is the case, it adds confidence in the validity of the levels.
In the case of the BTK, we measured the Fibonacci Retracements from the major lows in 2011 and 2014 to the recent all-time high in March. The reason we like this chart, and the levels highlighted as significant, is that the Fibonacci Retracements from each of the lows match up precisely with each other. Specifically, these are the key potential support levels as determined by the following Fibonacci Retracements:
3820-3835:
- 23.6% Fibonacci Retracement of the April 2014 to March 2015 Rally
- 61.8% Fibonacci Retracement of the February to March Rally
3535:
- 23.6% Fibonacci Retracement of the 2011 to 2015 Rally
- 38.2% Fibonacci Retracement of the April 2014 to March 2015 Rally
3050:
- 38.2% Fibonacci Retracement of the 2011 to 2015 Rally
- 61.8% Fibonacci Retracement of the April 2014 to March 2015 Rally
2270:
- April 2014 Low
- 61.8% Fibonacci Retracement of the 2011 to 2015 Rally
If you’ve been following the BTK in recent weeks (or today), you may recognize that 3820-3835 level. It is the precise area that has supported the index over the past few weeks, including today. If you were wondering why the biotech sector, which has led the market lower in the past few weeks, was holding up so well today, there’s your answer. The BTK has already reached one level of critical support and it has held, so far.
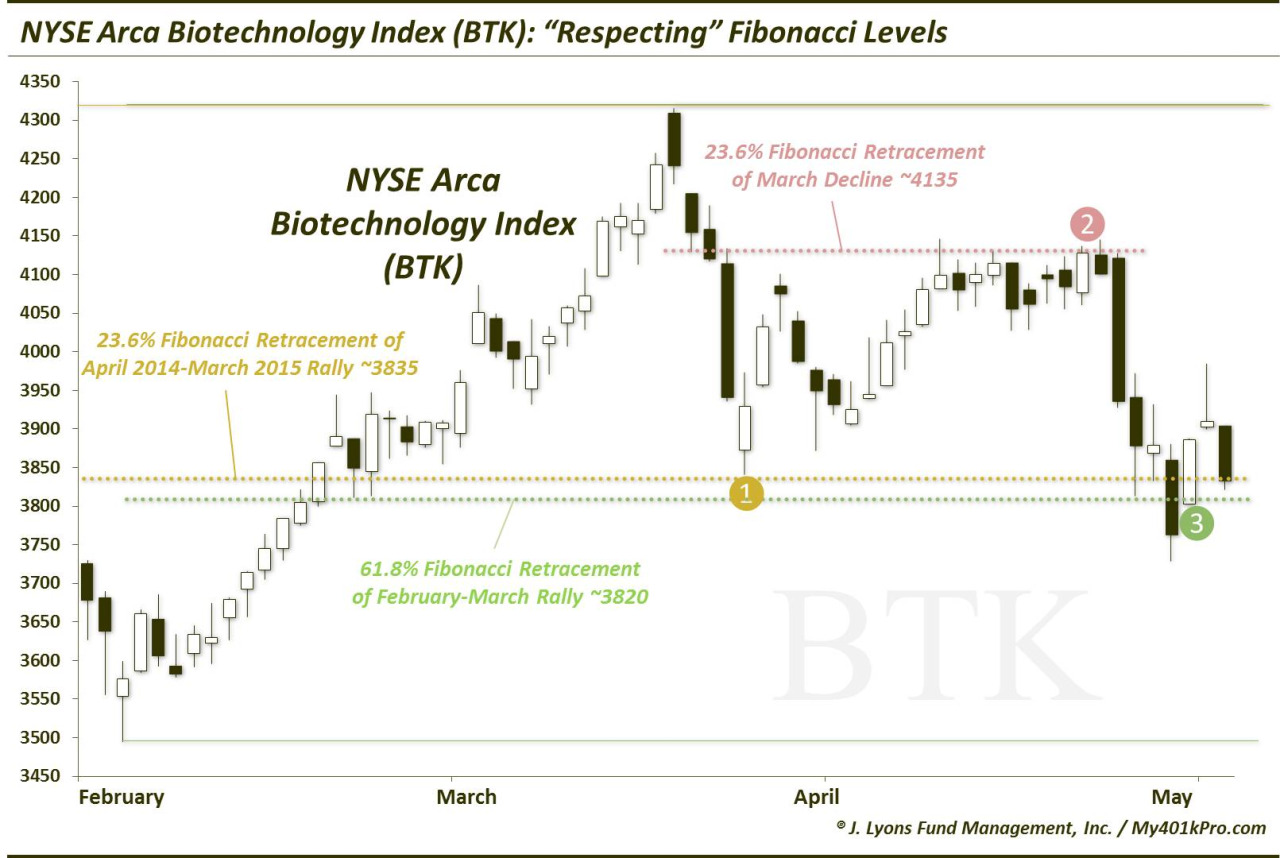
The fact that the BTK has held so precisely at the ~3830 level that is suggested as important by the Fibonacci Retracments is the other reason why we like this chart so much. And it is the reason why we are fairly confident that the other given levels are also important. When a security adheres closely – or “respects” – a level, it adds validity to that level as well as the successive levels based on the same analysis. Thus, since the BTK has respected the 3830 level thus far, we can have reasonable confidence that, should it eventually break, the BTK will respect the levels below it as well.
Furthermore, witness in the 2nd chart detailing how the BTK has closely respected other Fibonacci levels of late, including:
- 23.6% Fibonacci Retracement of the April 2014 to March 2015 Rally
- 61.8% Fibonacci Retracement of the March 2015 Decline
- 61.8% Fibonacci Retracement of the February to March 2015 Rally
The chart of the Biotech Index (BTK) is an example of one that we would be especially attracted to. It’s not just that the sector is the trendiest on the planet at this point in time. It’s because A) the BTK has closely respected Fibonacci levels recently and B) the Fibonacci Retracement levels from each of the major lows to the recent high precisely match up with each other. Because of those reasons, we have considerable confidence in our read of this chart. Specifically, just as the ~3830 level has proven to be valid as support for the BTK, we are confident that the other levels we’ve listed here will be valid as well.
Keep this post bookmarked – or keep the levels in mind – in the event that the Biotech Index breaks the recent support around 3820-3835.
_____________
More from Dana Lyons, JLFMI and My401kPro.
The commentary included in this blog is provided for informational purposes only. It does not constitute a recommendation to invest in any specific investment product or service. Proper due diligence should be performed before investing in any investment vehicle. There is a risk of loss involved in all investments.

