Will Spike In Rates Hurt Stocks?

The current consternation among global equity markets is centered around the recent considerable rise in bond yields globally. There seem to be equal numbers of folks who believe this development to be a legitimate threat and those who believe it’s just another distraction. Which camp are we in? As always, we prefer to take a quantitative, historical view of the matter (though, ultimately, we will let prices tell us whether or not to worry). We have looked at the spike in yields from a couple angles already in this blog, including concurrent short-term lows in the Russell 2000 and Treasury bonds (may be a short-term concern for stocks) and a negative divergence in corporate bonds versus equities (may be an intermediate-term concern). Today, we take another look at the issue within the context of the swift reversal in 10-Year Treasury Yields (TNX) recently and the effect this type of move has had on stocks in the past.
First of all, there are countless ways of defining the current interest rate “spike”, from the subjective to the quantifiable. Even in the quant category, there are endless ways of looking at the move. In order to stay objective, one has to draw the line somewhere in the definition of the spike. In this case, we kept it pretty straightforward, focusing on the extreme reversal of fortunes in the bond market. Specifically, we looked at prior occurrences when rates demonstrated the precise behavior as this recent move, going from a 52-week low to a 5-month high within a 4 month period.
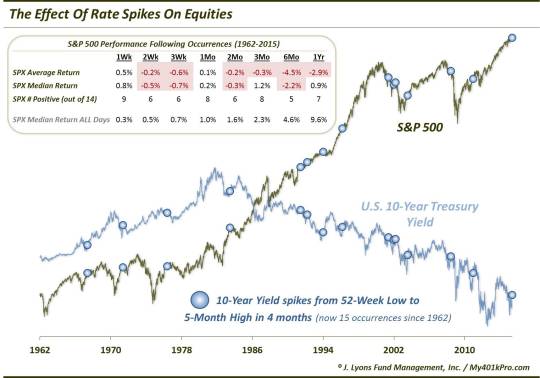
Since 1962, this is just the 15th unique occurrence. The previous 14 took place in the following months (using the earliest date when there was a string of occurrences):
- May, 1967
- May, 1971
- May, 1976
- June, 1983
- June, 1991
- March, 1992
- January, 1994
- March, 1996
- May, 2001
- December, 2001
- March, 2002
- July, 2003
- June, 2008
- December, 2010
Collectively, the impact of the reversal spikes in yield has not been kind to equities. The version on the chart may be difficult to see so here is a larger performance table on the S&P 500 following such events.
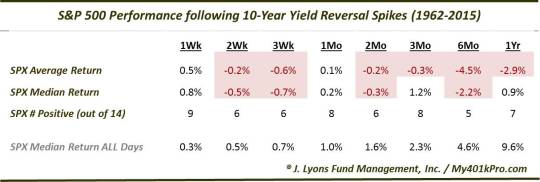
As the table shows, similar spikes in TNX have been rough on stocks, from the short-term all the way out to the long-term. Looking at the 6-month mark, for example, just 5 of the 14 prior occurrences showed a positive return. The median return was -2.2% and the average return was twice as bad. Looking out a full year, the average return was still negative. This is pretty significant underperformance, statistically, even if the sample size is limited.
These results lend credence to the argument that the spike in yields is a poor omen for stocks. That said, as always, there are exceptions to the rule. For example, the 1996, 2003 and 2010 occurrences saw no downside over any period following. Although, one might say the 2003 event bears little resemblance to the present as stocks were just emerging from a cyclical bear market at the time.
At the same time, however, the 2001-2002 and 2008 instances which contributed significantly to the poor overall results in the table differed from our current market as well. They occurred with the market well off of its highs as stocks were already knee-deep in developing bear markets. Incidentally, those events were the only ones that did not occur with the S&P 500 within about 3% of its 52-week high. Therefore, many of these precedents do, in some ways, resemble current conditions.
There will always be reasons to discard similar historical market events as irrelevant. Many of the reasons are likely sound as well, including the simple fact that no two markets are ever alike. However, various market patterns do repeat throughout time, whether due to an existential economic or market lifecycle or to the human natural tendency to respond to stimuli in a similar manner. Thus, we would not be so quick to dismiss historical precedents, or the lessons they contain, which bear some resemblance to present market conditions. Accordingly, the recent spike in bond yields would appear to have historical evidence to back up those who harbor concerns about its potential negative impact on stocks – a negative impact that may be of a long-term nature.
_____________
“Railroad Spike” photo by BillOGG Photography.
More from Dana Lyons, JLFMI and My401kPro.
The commentary included in this blog is provided for informational purposes only. It does not constitute a recommendation to invest in any specific investment product or service. Proper due diligence should be performed before investing in any investment vehicle. There is a risk of loss involved in all investments.