Economically Key Industrial Metals Complex Breaking Down?

On March 5, we noted that the S&P GSCI Industrial Metals Index was “Hanging On The Precipice” of a major long-term support level. At the time, the global deflationary spiral was reaching its nadir as all matters of commodities and pricing metrics were reaching multi-year lows. Not coincidentally, the U.S. Dollar was soaring at the time to new 12-year highs. The concern with the Industrial Metals space threatening to break down was the inherent message vis-a-vis the global economic outlook. As we stated in the March post:
It makes sense that pricing of industrial metals (like aluminum, copper, nickel, zinc, etc.) would make for a decent barometer of economic strength. These metals go into the manufacturing of a myriad of products. Thus, their pricing, i.e., a sign of the level of demand for these metals, is a tip off to the level of global economic demand present.
The failure of the Industrial Metals complex to hold key support would appear, to us, to bode ill for the global economic outlook. The key support level threatening to give way was the 61.8% Fibonacci Retracement (near 307) of the rally from 2009 to 2011 to which the Index had recently dropped. That level, at the time, had held for several days, confirming its relevance, and perhaps significance, as a support level.
We had seen the price of crude oil as well as the comprehensive CRB commodity Index break their own such 61.8% Fibonacci levels en route to major collapses. However, we also saw copper hold its similar level so it appeared that the Industrial Metals could go either way. Considering the lack of any bounce at all off of the 61.8% level, the chart had the looks of a continuation pattern. Thus, our suspicions were that the index would eventually break down. Well, our suspicions were correct…for 1 day. On March 18, the Index appeared to be breaking down, only to reverse itself the following day and commence a furious rally over the subsequent 6 weeks. After jumping some 13%, the Industrial Metals Index tested its previous break-down level from December near 345 – and failed.
Over the past 6 weeks, the Industrial Metals Index has gotten pummeled, losing its entire post-”false breakdown” gains. It has returned to the key 61.8% support level around 307 and, this time, it is threatening to slice through it.
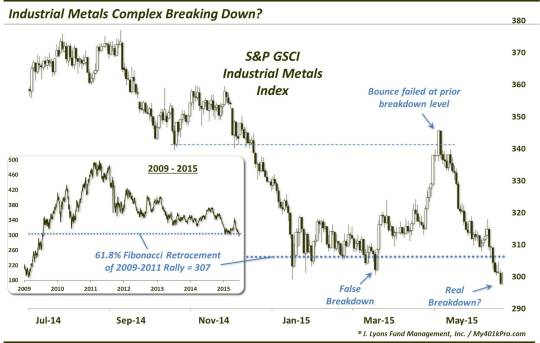
The fact that the Index has dropped immediately to new 6-year lows is a concern. One would expect prices to at least be temporarily slowed by the prior lows. The failure to do that suggests a dearth of demand at this formerly key level. That said, prices could certainly be setting up another false breakdown. If the index is able to recapture that 307 line in short-order, that possibility cannot be overlooked. That could further lead to the potential of this down move being a successful test of the March lows. Thus, all of this action near the 61.8% line could just be a complex bottoming process. Furthermore, and we are looking well ahead here, if such a successful test leads to a rally above the May highs, it could signify a potentially major long-term low in the Industrial Metals complex.
However, that is merely the “could be”. We prefer to deal with the “what is”. And what is happening is that the Industrial Metals Index is breaking down below the key 61.8% Fibonacci Retracement of the 2009-2011 rally. Further breakdown in prices could, again, be a sign of global economic weakness. And perhaps arguing for a further breakdown in prices is the recent action in the U.S. Dollar.
Interestingly, in March, when the Industrial Metals Index was last breaking down, it was doing so in the face of a soaring dollar. That is not the case now. In fact, since the Index peaked in early May, the U.S. Dollar is actually lower by about 1.5%. Therefore, we can’t merely look at this as an anti-dollar move. It has come of its own accord, without the headwinds of a U.S. Dollar rally. If the Dollar were to rally, it’s possible we could see a significant acceleration of this plunge in the Industrial Metals.
For now, we’ll just focus on that 307 level. Above it, the Index has a chance to rally. Below it, it could be bombs away. Right now, we are below it. Therefore, we will continue to look for more downside in the Industrial Metals. And that downside could mean more than just losses in this space – it could be a warning sign for global economic demand.
________
“industrial steel pattern” photo by Cesar Gonzalez.
from Dana Lyons, JLFMI and My401kPro.
The commentary included in this blog is provided for informational purposes only. It does not constitute a recommendation to invest in any specific investment product or service. Proper due diligence should be performed before investing in any investment vehicle. There is a risk of loss involved in all investments.