“Dr. Copper” Back On Life Support

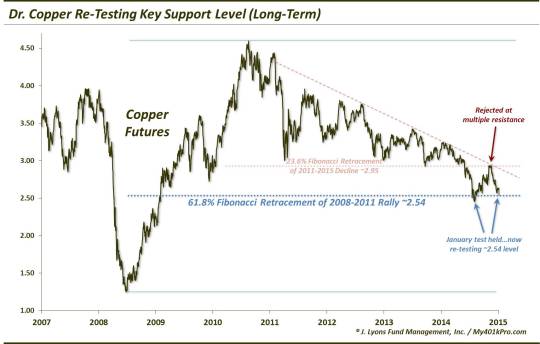
Back on January 14, in the midst of the deflationary spiral in commodity prices, we wrote a post titled “Dr. Copper Positioned For Rebound…Or Collapse”. At the time, the price of copper (so named “doctor” for its supposed economic forecasting ability based on the level of demand for the metal) was in full-on crash mode. It was, however, hitting what we deemed a major long-term level of potential support, the 61.8% Fibonacci Retracement of copper’s rally from 2008 to 2011, around 2.54. Although it seemed far-fetched at the time given the collapse in prices, we thought if copper could stabilize at that key level, it could mount at least a serious intermediate-term bounce. Then again, given the similar crashes in other commodities, such as crude oil, it was not inconceivable that the metal could continue crashing. Thus, the “hedged” title of our post.
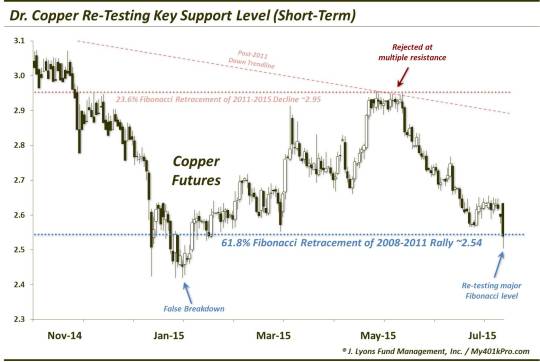
Well, perhaps somewhat shocking to most macro observers, copper prices did stabilize – immediately. The intra-day low occurred on the very day of the post. And while copper spent a few days below that 2.54 level in the subsequent weeks, it recovered the level quickly. A rebound quickly ensued, as we had surmised. By early May, copper had reached the upper target that we had laid out in the post, 2.95, which represented an 18% gain from the key support line we identified. In a post on May 16, we outlined the challenges facing the metal at that 2.95 level, specifically:
- the breakdown level of the March and October 2014 lows
- the 23.6% Fibonacci Retracement level of the 2011-2015 decline
- the post-2011 down trendline
The copper bounce did stall at that level. In fact, the very high in copper prices during the first half rally happened to be 2.95 to the penny. Now lest you think we nailed every single bit of the action in copper these past 6 months, that was not exactly the case. While copper was unable to overcome the 295 level, it did consolidate in that area for some time (13 days, specifically) after hitting the level. So although we always caution against anticipating a breakout, we thought the potential “bull flag” on the chart gave copper a fair chance at breaking out to higher highs.
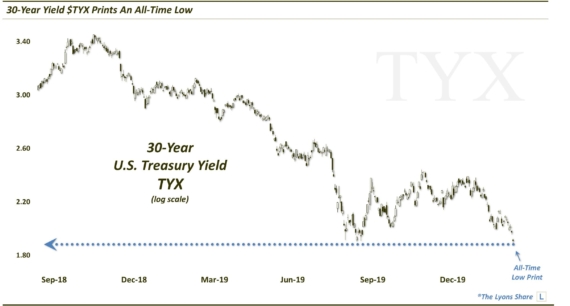
It was not meant to be and copper has retraced its rally over the past 2 months – all of it. It is right back down to that all-important 2.54 level again, marking the 61.8% Fibonacci Retracement of its 2008-2011 rally. Given the significance of this level, in our view, that puts Dr. Copper back on “life support”.
Long-Term Chart:
Short-Term Chart:
We say life support because this is likely the most significant support level on the chart of copper. And given its January encounter at 2.54, it should be some degree weaker as a support level than the first time. We are seeing this play out in the related industrial metals space. Should it break here, it could have roughly 20% immediate-term downside to about the 2.00 level.
Now, the other side of the story is that, perhaps, this is simply a re-test of the initial January low and copper prices will be able to rally trongly off of this level, should it hold. This includes a potential scenario whereby the 2.54 level is broken but recovered in very short order. In that scenario, copper could be setting up a long-term bottom that could last for years potentially.
What is the big deal about what copper does? Well, as we wrote in the May post, copper could be considered a reasonable barometer of at least the direction of prices, if not the global economic demand picture as a whole.
In our view, this 2.95 level is key, not just in the near-term movement in copper, but also as representative of the inflationary vs. deflationary debate. Below there, deflation could remain the dominant force. Above that level, copper has a chance to move higher, and perhaps a lot higher. That could also signify that the worst of the deflation scare is behind us.
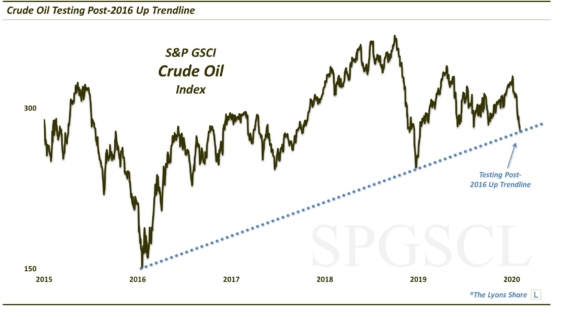
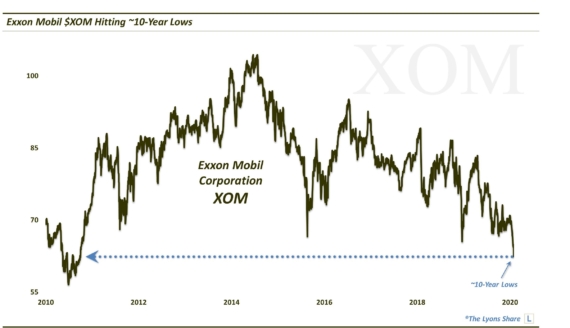
Of course, we know now that copper could not surpass that 2.95 level. It is, thus, probably no surprise that deflationary forces have begun to creep forth again concurrent with this recent drop in copper prices. This includes, as we have mentioned, the industrial metals space, in general, as well as, very recently, the energy complex. This bout of deflationary pressure likely does not bode well for the global economic story at large.
One piece of data backing up the notion of the global economic influences on this recent bout of deflation comes from the U.S. Dollar. During the commodity beat-down at the end of last year and beginning of this year, the Dollar was in the midst of a vicious rally. In fact, the drop in commodities was (and reasonably so) portrayed by some as a “strong Dollar” story more than a comment on the global economic well-being. This recent drop in prices has been different, however. It has occurred even as the Dollar has moved sideways at best. We are not economists, but that dynamic would not seem to paint a favorable picture for global economic demand.
Whatever the economic message (if there is one) behind the current action in copper prices, from a trading perspective, the message would seem to be a straightforward one. If copper prices can maintain the 2.54 level, or quickly regain it following a break, it can move higher. And considering the importance of this current level, it could potentially be supportive of a long-term, cyclical advance. However, should this level fail, it could be katy bar the door for copper prices in the near to intermediate-term.
___________________
More from Dana Lyons, JLFMI and My401kPro.
The commentary included in this blog is provided for informational purposes only. It does not constitute a recommendation to invest in any specific investment product or service. Proper due diligence should be performed before investing in any investment vehicle. There is a risk of loss involved in all investments.