The Junkie Market-Nasdaq Edition (Too Many Highs & Lows)

A couple weeks ago, we posted a piece titled “The Junkie Market”. The focus of the post was on the number of New Highs and New Lows being registered on the New York Stock Exchange, specifically, the elevated level of each series. The point was that, historically, the occasions of large numbers of NYSE New Highs AND New Lows at the same time did not bode well for the stock market. This condition is the main tenet of the Hindenburg Omen and, while often ridiculed, there does appear to be validity to its warning. Today, we look at the same criteria applied to the Nasdaq. And we find similar potential reason for caution.
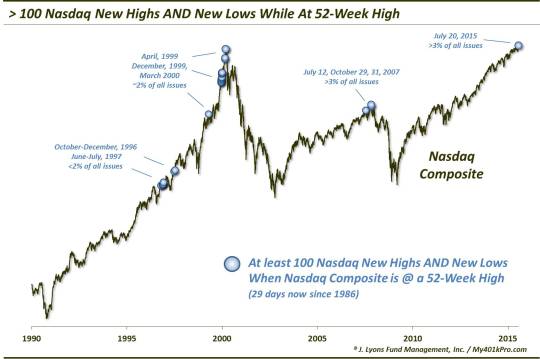
Specifically, due to the occurrence on July 20, we looked at all instances where the Nasdaq Composite closed at a 52-week high with at least 100 stocks hitting New Highs AND 100 hitting New Lows. Since 1986, July 20 marked the 29th day meeting such criteria. (We understand that 100 is a static number and seemingly not as relevant as New Highs and Lows as a % of total issues. However,
the number of issues on the Nasdaq is currently at the low end for the entire period covering our NH/NL database (since 1986). Thus, if anything, it makes current signals more relevant, as shown below).
These were the months marking the occurrences:
- October-December 1996
- June-July 1997
- April 1999
- December 1999
- February-March 2000
- July 2007
- October 2007
- July 2015
As you can see, this is another example of the growing emergence of data points that echo the previous 2 cyclical tops. The 1996 occurrences essentially saw the Nasdaq move sideways for a couple of months before resuming its uptrend. The 1997 instances were followed by even less struggle as the index plowed higher. The 9 occurrences during those years took place as the Nasdaq was setting a record in the number of issues trading on its exchange at more than 5000. Thus, the “100″ marker represented less than 2% of all shares at that time. Additionally, the number of New Highs on those 9 dates during 1996-1997 averaged 219 while New Lows averaged 111. So, despite the large number of New Lows, they were still roughly just half of the New Highs.
The 1999-2000 dates took place with roughly 4700 stocks trading on the Nasdaq so 100 equated to more than 2%. The April 1999 occurrence led to an immediate 10% decline the following week. And of course, the December 1999-March 2000 occurrences took place during the final blow-off stage of the Nasdaq bubble. So while the Nasdaq was able to tack on gains following the earlier of those dates, they were eventually given back in spectacular fashion.
The 2007 occurrences happened at a time when just over 3000 stocks were trading on the exchange, in comparison with today’s number at just under 3000. Thus, 100 New Highs or Lows would account for over 3% of all issues traded. The July 2007 instance marked the only one of the 28 prior dates that saw more New Lows than on the recent July 20, 2015 occurrence (155 vs. 154). That occurrence saw the Nasdaq hang up for about a week before dropping roughly 10% over the following month. The October occurrences marked the top of the Nasdaq cyclical bull market.
In fact, following the last 5 times the Nasdaq closed at a 52-week high with at least 100 Nasdaq New Highs and 100 New Lows, the market was unable to make much, if any, further headway for a long time.
- March 10, 2000 (*cyclical top-0 higher closes over next 15 years)
- July 12, 2007 (35 higher closes over next 4 years)
- October 29, 2007 (2 higher closes over next 4 years)
- October 31, 2007 (*cyclical top-0 higher closes over next 4 years)
- July 20, 2015 (TBD…0 higher closes so far)
Of note, this recent July 20 occurrence was also the only one that saw more New Lows than New Highs. In fact, as we stated in last week’s post on “July 20: The Thinnest New High In Stock Market History”, other than 3 days in April 1999, it was the only Nasdaq 52-week high period going back to 1986 that saw more New Lows than New Highs.
So why should the occurrence of significant numbers of New Highs and New Lows at the same time be a bearish sign? Like we said in the July 16 post on the NYSE version, we’re not sure why but perhaps it is that “there are a number of stocks below the surface that are breaking down – yet enough that are still performing well to mask that weakness and prevent market participants from getting too bearish.” That dynamic that keeps participants from worrying too much about the deteriorating internals – and keeps them in the market – is just the thing that can set them up for significant losses.
We’re not going to suggest that July 20 necessarily marked a cyclical market peak, not to be surpassed for the next 4 years. However whatever the dynamic is that produces these 52-week market highs with an abundance of New Highs AND New Lows, its timing has been extremely dubious to say the least. Therefore, you might say that one would have to be high to ignore its track record.
__________
More from Dana Lyons, JLFMI and My401kPro.
The commentary included in this blog is provided for informational purposes only. It does not constitute a recommendation to invest in any specific investment product or service. Proper due diligence should be performed before investing in any investment vehicle. There is a risk of loss involved in all investments.