The Long & Short (Term) Of The Pharmaceutical Sector

We have written many times about the challenge of weighing positive vs.negative inputs when analyzing the attractiveness of the investment climate. Often times, that applies on a durational level. That is, things may appear favorable on a short-term basis but not so on a long-term basis – or vice-versa. So it is with the NYSE Pharmaceutical Index currently, the “DRG”. If you have not been following it, the pharma sector has been sort of the poor man’s biotech, having doubled over the past 3 years. The kicker with the sector is that it has enjoyed relatively little volatility along the way, especially compared to the biotechs. The DRG has closed below its 200-day moving average on just 6 days in the past 3 years – all in October of last year. Currently, the chart of the DRG is at an interesting juncture, offering a bit of good and bad news, depending on the duration.
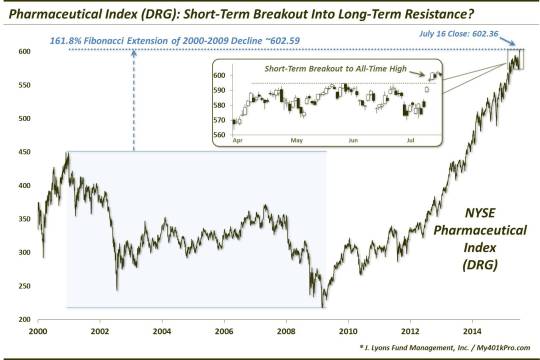
First the good news, as represented by the short-term. After continuing to rally to new highs early in the year, the index has generally been moving sideways since April. After this healthy 3-month consolidation, the DRG has once again broken out to new all-time highs in the past week. Nothing at all to complain about there.
Now the perhaps not-so-good news, on a longer-term scale. You’ve probably heard us talk Fibonacci levels many times. One way in which they are utilized is by “extensions” once a range is broken. For example, after a decline from point A to point B, should price break out above point A, it has a tendency to move up in magnitudes of the A-B range based on Fibonacci levels. The most consistent that we have found is (no surprise) the “golden” Fibonacci figure of 61.8%. That is, once point A is broken, price tends to find some resistance 61.8% above the range of point A-B. This is best illustrated by a real example and the DRG provides a perfect one.
The DRG hit an all-time high of 455.28 in 2000. From there, it eventually fell to a low of 216.91 in the year 2009. The range between those 2 points is 238.37. 61.8% of that range is 147.31. Thus, the 161.8% Fibonacci extension of the range is 455.28+147.31 = 602.59. Theoretically, the DRG may find that level to be resistance. Following its recent breakout, it closed yesterday at 602.36.
So which do we weigh more heavily? It depends on one’s duration. If you have a longer-term time horizon, the long-term Fibonacci Extension may take precedent. You might not be so focused on short-term precision and may take the opportunity to take some exposure off here in the vicinity of the Extension. Plus, if you have extensive exposure to the sector, that strategy may make sense as well.
On the other hand, if you are a short-term trader, the near-term breakout may take precedent. You might ride it as far as it goes before it shows signs of breaking momentum. Furthermore, even if the Fibonacci Extension ends up being relevant, it may not be precise. That is, months from now, it may be that the DRG has had trouble sustaining any gains above the 602 level. But in the short-term, it may reach several percentage points above there.
This is a perfect example of weighing the positive versus the negative on a durational basis. The short-term breakout is an extremely positive development. However, the long-term may provide a challenge for the DRG in sustaining gains above here. The answer to navigating the challenge may lie in your durational focus. They are each relevant in our mind. The priority of the relevance may depend on your investing versus trading horizon.
__________
“Happy Pills” photo by Judit Klein.
More from Dana Lyons, JLFMI and My401kPro.
The commentary included in this blog is provided for informational purposes only. It does not constitute a recommendation to invest in any specific investment product or service. Proper due diligence should be performed before investing in any investment vehicle. There is a risk of loss involved in all investments.