The Junkie Market, Part lll-Too Many NYSE AND Nasdaq Highs & Lows

This brief post will serve as the coup de grace for our “Junkie Market” series. By that, we are referring to days on which there are numerous (in this case, at least 100) new 52-Week Highs AND 52-Week Lows. We have covered such occurrences on the NYSE and the Nasdaq exchanges. If you’ll recall, these events tended to pop up near cyclical market tops. Thus, the forward returns in the averages were very poor, especially in the longer-term. Inspired by yesterday’s occurrence, today’s Chart Of The Day looks at days on which there were at least 100 New Highs and Lows on both the NYSE AND Nasdaq.
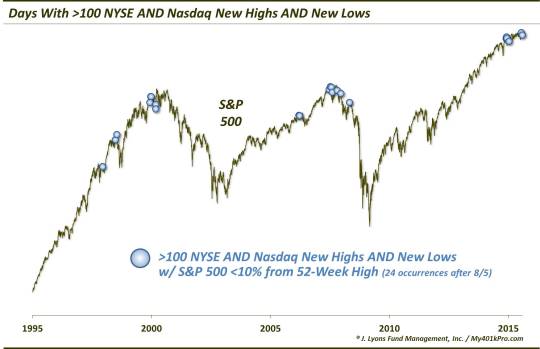
As you might expect, the timing of these dates was not too auspicious. They were primarily concentrated around the 1998 intermediate-term top and the 2000 and 2007 cyclical tops. Additionally, there have now been 7 occurrences in the past 7 months. Judging by the historical performance in the S&P 500, this is a bit of a concern for market participants.
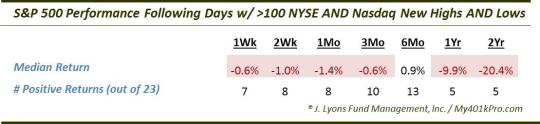
It is not necessarily the death knell for the bull market. There have been occasions after which the S&P 500 fared alright in the longer-term. However, of the 17 occurrences which happened far enough in the past to provide a measurement, just 5 showed a positive return 1, and even 2, years later. Furthermore, obviously given the location of many of the events near cyclical peaks, the median 2-year return is a paltry -20.4%. Therefore, one would be bucking pretty stiff odds to dismiss this development.