Indian Stocks Ready To Resume Bull Market?

After consolidating their big run, Indian stocks are approaching a potential significant support area.
Our choice for country stock market of the year for 2014 was India. With all due respect to China and its flashy, parabolic rally during the latter half of the year, the Indian market was much more our cup of tea as investors. After an initial secular bull market rally from 2003 to 2008, the Indian stock market consolidated those gains into 2014. On March 7, our Chart Of The Day revealed the breakout of the Indian S&P BSE Sensex Index from this long base formation. Unlike many of the breakouts in recent years, this one held and the Sensex went on to rally for roughly the next 12 months.
In January to March of this year, Indian stocks encountered an area of potential pause that we had identified on the Sensex charts around 30,000. We targeted this area due to a confluence of Fibonacci analyses. As you probably know, we find much value in Fibonacci tools, especially when various levels line up in close proximity with one another. This was indeed the case with the Sensex Index based on various Fibonacci Extensions and Projections derived from prior rallies and ranges. We detailed these in a February 24 post titled, “Indian Stocks May Be In For Breather. Here is the chart from that post:
From February 24:
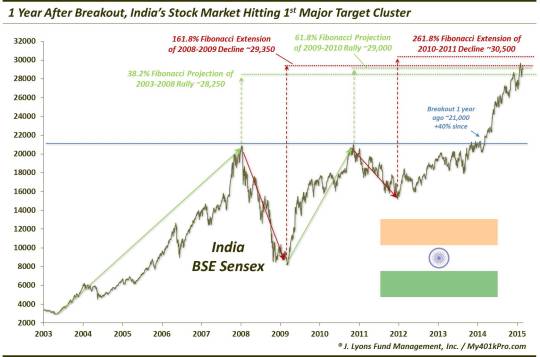
The Sensex did indeed run into resistance in the identified area, topping out on March 4 at 30,024. Since then, it has fallen as much as 17%, as of this week. So it would have been a good call to trim some exposure, or avoid the market altogether, back in the 1st quarter. The good news is that the Sensex is now approaching a potential level of support, based on an assortment of analyses.
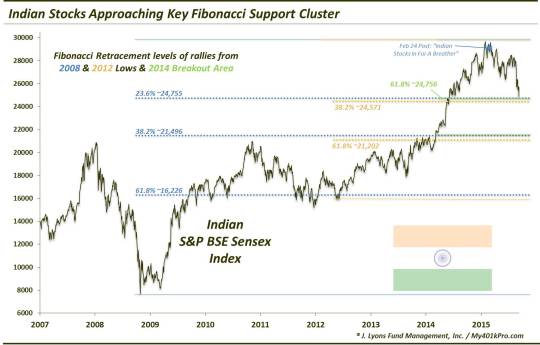
First off, we have another one of those Fibonacci clusters. This time, it consists of 3 key Retracement levels from the major lows in 2009 and 2012 as well as from the 2014 breakout level, all lining up in the same vicinity near 24,600:
- 23.6% Fibonacci Retracement of 2009-2015 Rally ~24,755
- 38.2% Fibonacci
Retracement
of 2012-2015 Rally ~24,571
- 61.8% Fibonacci
Retracement
of Rally from March 2014 Breakout Level ~24,756
Here is the chart showing the Sensex approaching this confluence of Fibonacci levels.
The 2nd piece of potential major support comes from the long UP trendline from the kickoff of the Indian secular bull market in 2003. Using a logarithmic scale, this trendline precisely connects the 2003, 2009 and 2013 lows. And it is fast approaching current price levels now.
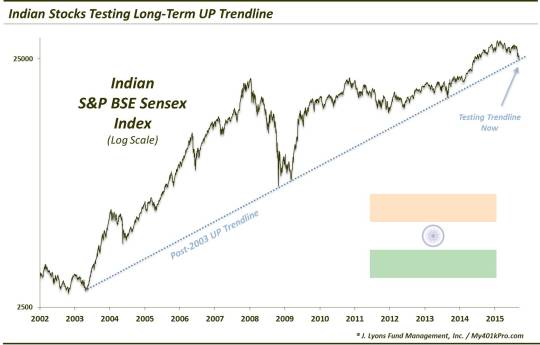
Considering the state of affairs in most global equity markets, i.e., working off the recent post-crash cobwebs, a retest of this week’s lows in the Indian market would not be surprising at all. Even a new marginal low would be unsurprising, and perhaps even expected. On such a retest, however, the Sensex should hold the Fibonacci levels mentioned above if the market is to resume its bull market in the near future.
Additionally, a temporary break below the post-2003 UP trendline would not necessarily equate to the demise of the Sensex’s bottoming chances. However, any break would need to recover the trendline in very short order. Failing to hold, or quickly regain, these key levels would open up the breakout level around 21,500 to a potential test. And while that will likely be in the cards eventually, the Sensex does stand a good chance of bouncing from the nearby area first.
In Indian culture, it is common practice to worship the “bull”. Should the level mentioned above be successful in supporting the Sensex, the country’s investors may well be worshiping a different kind of bull for some time to come.
(No disrespect meant by the analogy.)
______
“Bull.” photo by Prabhu B Doss.
More from Dana Lyons, JLFMI and My401kPro.
The commentary included in this blog is provided for informational purposes only. It does not constitute a recommendation to invest in any specific investment product or service. Proper due diligence should be performed before investing in any investment vehicle. There is a risk of loss involved in all investments.