Oil Stocks Testing Breakdown Level Of Long-Term Uptrend

One of the biggest casualties of the recent stock market decline has been energy stocks. One may even argue that they are the culprit, or at least one of many. This includes oil stocks. Using the XOI (now the NYSE ARCA Oil & Gas Index) as a measuring stick, we can see how much damage has been done to these stocks, both recently and over the past year. This is especially true relative to the major stock averages which began the recent plunge not far from their respective 52-week highs.
At present, the XOI finds itself in a very interesting spot from a longer-term perspective. Looking at the chart, you can see why we say that.
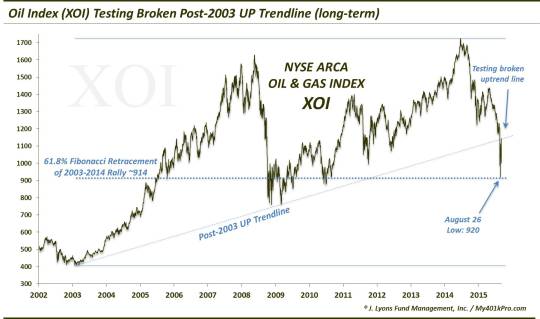
In the most recent decline, the XOI encountered 2 lines of major significance. One of the encounters proved constructive for the index, the other did not. The first line was the UP trendline connecting the 2003 and 2009 lows. The XOI blew right through that line (near 1134 at the time) in an August 21 plunge of -14%. The implications of the break of this line cannot be overstated considering the importance of the 2 lows connecting it. From a long-term perspective, this is a potentially very negative development for the XOI.
The other encounter went a little better. The ultimate low in the XOI following the trendline break occurred 3 days later at 920. This was almost right on the 61.8% Fibonacci Retracement of the 2003-2014 rally which sits at 914. While the trendline break signaled a loss of secular (long-term) upward momentum, the 61.8% line marks, in our view, perhaps the “line in the sand” concerning the fate of the post-2003 secular uptrend in the XOI. Thus, holding there was key.
The bounce produced by the 61.8% line has been interesting, first in its magnitude at +24%. Most interesting, however, is where the bounce has ended up: back at the broken trendline in the 1130′s. Here is a closer look.
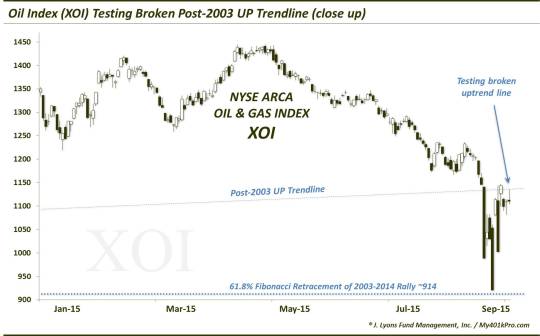
The reaction here will be key, for the near-term and possibly for the long-term. If the XOI fails here, it would appear to have little support down to a retest of the 61.8% line. And the longer it stays below the broken trendline, the more significant the break becomes. That is, the more negative the connotations are for the longer-term prospects of the sector.
If the XOI is able to regain and hold the old trendline in short order, it could arguably be considered a false breakdown. This could imply that the long-term prospects of the secular post-2003 uptrend remain intact, though bloodied a bit. In the short-term, it could also spur a massive short squeeze/mean-reversion rally in a sector that, from an intermediate-term perspective became about as washed out as you will ever see.
If you’re watching this sector, and the index, the key is simple, in our view. Above the trendline, near 1130-1140, prospects are bullish for the XOI, with immediate upside to the low 1220′s breakdown level (~7%) – and longer-term prospects, much higher. Below that line, prospects are bearish, with immediate downside to the 914 level.
_______
More from Dana Lyons, JLFMI and My401kPro.
The commentary included in this blog is provided for informational purposes only. It does not constitute a recommendation to invest in any specific investment product or service. Proper due diligence should be performed before investing in any investment vehicle. There is a risk of loss involved in all investments.