It’s official. The Dow Jones Industrial Average and S&P 500 have entered a long awaited correction.
There’s been a lot of chatter recently about a metric called the VVIX. What does it do? It measures the volatility of volatility. The CBOE breaks it down like this:
“Every asset class deserves its own volatility index, including volatility itself. The VVIX Index is an indicator of the expected volatility of the 30-day forward price of the VIX. This volatility drives nearby VIX option prices. CBOE also calculates a term structure of VVIX for different VIX expirations.”
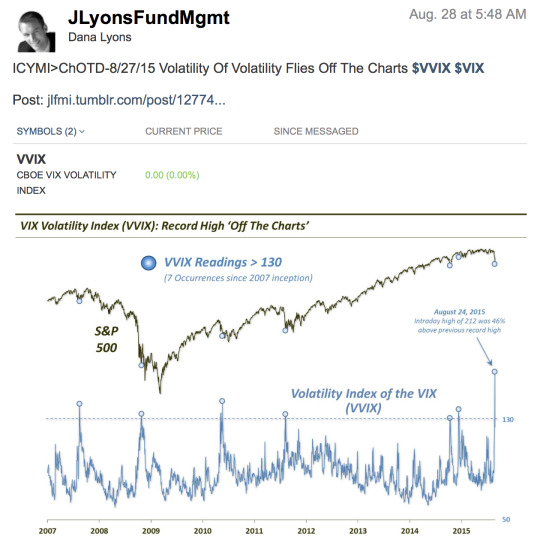
Essentially, this instrument can help you gauge just how rare and powerful the VIX is moving at any given moment. So if you watch volatility or constantly check the VIX you should consider adding this to your arsenal. The VVIX, last week, actually hit levels higher than it did during the 2008 Financial Crisis!