General Electric Encountering Colossal Resistance…Again

We do not cover individual stocks too often in these pages as we do not buy them in our managed accounts. In order to present a single stock here, it has to be one of major significance, i.e., a potentially market-moving bellwether – and it must be facing something very noteworthy on its chart. In the case of General Electric (GE), it fits both of the criteria. In fact, we have written a couple of posts about GE over the past few years, including in April 2014 and again in April of this year. The interesting thing is, this post addresses the very same issues as those prior ones. The stock of GE is again encountering multiple layers of significant resistance…though, it may stand a better chance of overcoming them this time.
Here is the chart:
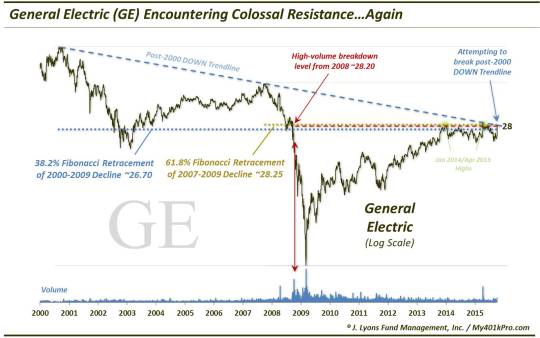
The layers of resistance facing GE near the 28 level are the same as discussed in prior posts in the past few years, namely:
- 38.2% Fibonacci Retracement of 2000-2009 Decline ~26.70
- 61.8% Fibonacci Retracement of 2007-2009 Decline ~28.25
- High-volume breakdown level in 2008 ~28.20
- January 2014 and April 2015 highs near 28.00-28.50
Additionally, there is a major line of resistance near 28 that we did not include in the prior posts, because we had not noticed it. Using a logarithmic scale, the DOWN Trendline connecting the 2000 and 2007 peaks in GE lies right at $28 now. Back on April 10 when the stock gapped up, jumping some 10% on the day, guess where it stopped? Precisely at the post-2000 DOWN Trendline (paging the “markets are random” crowd).
So GE is back at the same colossal resistance again where it twice failed before. Will this resistance be as formidable this time, or will the 3rd time be the charm? Well, we do not like to anticipate breakouts or breakdowns so we will treat this 28 area as resistance until proven differently.
That said, there are a few reasons why we think General Electric may have more success in its encounter with this resistance area this time. For one, the stock has already bumped against the area twice. Triple tops are few and far between, so a halt here again would be surprising in that regard. Also, related to that point, it is said (and we agree) that the more times a level gets tested, the more likely it is to be broken.
Additionally, GE’s stock is currently showing relative strength (i.e., leadership) both among its peers and among the overall market that it has not shown in prior trips to this level. So it has some momentum. Importantly, pertaining to that momentum, the stock is not in a long-term “overbought” state. Perhaps in the near-term it is, but having sold off sharply in the August market correction, GE’s recovery has not yet had a chance to reach “overbought” status. So it should have a little juice left in its tank to possibly push through this area.
Furthermore, the market in general is early on in what could be an intermediate-term rally, lasting perhaps several more months. Yes, the market has come a long way, but it is only about 8 days into its rally.
We have been pretty pessimistic on the prospects for General Electric’s stock for the past 18 months given the formidable resistance facing it. In this current test, however, it looks to us like the stock may have a better chance of overcoming the 28-ish area. If that is the case, as we finished the April 2015 post, “it could be a major long-term positive development for GE’s stock. And if the bellwether notion is valid, it could also provide a boost for the industrial sector and the overall market.”
________
“ge” photo by Mike.
More from Dana Lyons, JLFMI and My401kPro.
The commentary included in this blog is provided for informational purposes only. It does not constitute a recommendation to invest in any specific investment product or service. Proper due diligence should be performed before investing in any investment vehicle. There is a risk of loss involved in all investments.