Israel Stock Market In A Precarious Spot

Tel-Aviv 100 in danger of undergoing a failed breakout of a massive 8-year rising wedge.
There has certainly been no dearth of excitement in the U.S. equity market over the past few months. Crashes, face-ripping rallies and general volatility have been the norm. However, even when things are slow domestically, as they were during the first 6 months of the year, expanding one’s investment horizons beyond our borders can introduce investors and traders to literally a whole other world of potential excitement – and opportunity. And with ETF’s expanding into new markets all the time, most of these markets are now more easily accessible (note: there are important issues, like currency risk, that are inherent in these products so do your due diligence carefully).
In our management practice, we scan the globe in search of attractive opportunities on a daily basis. Sometimes, we identify potential opportunities, and sometimes we just find interesting charts. The one here may fall into both categories. It is the chart of Israel’s Tel-Aviv 100 (TA100) stock index.
This one is particularly interesting for a few reasons. First and foremost is the prominent and massive “rising wedge” pattern the index carved out from 2007 to the beginning of 2015. This pattern is characterized by higher lows and higher highs – with the latter rising more shallowly than the former. Despite the higher lows and highs, rising wedges are more often than not resolved to the downside. That is, prices break below the lower UP trendline connecting the lows.
That is not always the case, however. As we see in the chart below, the TA100 broke out of the rising wedge to the upside in February of this year. And actually, for much of the spring and summer, the index was unique, globally, in that it was making new all-time highs. However, things do not look so rosy (potentially) for the TA100 at this point.
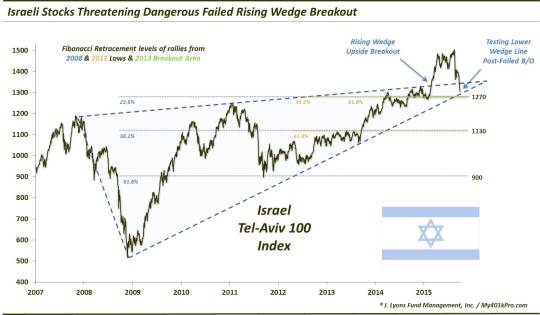
After peaking in mid-August, the TA100 has been in a steep descent along with the rest of the global equity markets. Importantly, the index has now broken below the top of the rising wedge, indicating a potential failed breakout. This is significant because failed breakouts, more times than not, lead to breakdowns.
With the wedge now nearly reaching its apex, a failed breakout would be confirmed, in our view, if the TA100 broke below the lower trendline. And, as the apex is near, the two lines are very close together. Thus, it is not surprising that the index has already dropped to test the lower line. That is where it sits currently. This is a precarious situation as a breakdown below this bottom line would confirm the failed breakout.
What is the potential downside in such a scenario? Obviously, it depends on the duration but, eventually, it could be the entire height of the wedge, i.e., all the way down to the 2008 lows. Obviously, it would not happen is one fell swoop. However, that would be a not-entirely far-fetched outcome. And FYI, that would be roughly a 60% drop (1300 down to 500).
There are a couple other positive factors the index has going for it in the current price vicinity. These include:
- The lateral breakout spot from February
- The 23.6% Fibonacci Retracement level of the 2008-2015 rally
-
The 38.2% Fibonacci Retracement level of the 2011-2015 rally
-
The 61.8% Fibonacci Retracement level of the rally since the 2013 breakout
- Additionally, the 500-day
(200-week) simple moving average is in this vicinity
These factors may well serve to support the TA100 in this area, preventing a breakdown below the lower bound of the rising wedge. In that case, the current move could merely be a test of the breakout spot from early in the year before the index moves on to new highs again.
However, if the lower bound of the wedge is broken, it would be especially negative considering these other factors would also be broken. The immediate downside would appear to be around 1130 (-13%) near the next cluster of Fibonacci levels. And below that, near 900 (-30%).
Ultimately though, again, the risk involved in a failed breakout of the massive rising wedge on Israel’s Tel-Aviv 100 chart may ultimately be the 2008 lows, about 60% below current levels. Considering the area of the globe where the market resides, a drop of that magnitude would likely be accompanied by some sort of geo-political circumstances. We obviously cannot predict what those may be, nor would we even attempt to. We’ll just stick to the chart. And based on that, the TA100 would be well served to avoid breaking the lower bound of the wedge that it is testing right now.
_______
More from Dana Lyons, JLFMI and My401kPro.
The commentary included in this blog is provided for informational purposes only. It does not constitute a recommendation to invest in any specific investment product or service. Proper due diligence should be performed before investing in any investment vehicle. There is a risk of loss involved in all investments.