Leading Chip Sector Hitting Resistance

Semiconductors have been among the strongest sectors during the October stock market rally; however, the sector is now running into potentially stiff resistance.
Our blog posts over the past few weeks have mainly focused on tracking the progress and dynamics of the post-September rally in stocks. This includes monitoring the quality of the bounce and, thus, the likelihood of it continuing. Additionally, it has included keeping an eye on the various segments and sectors of the market to see which ones are rotating into potential leadership – or laggard – status. One sector that has rotated from laggard to leader in the past few weeks is semiconductors.
The semiconductors, a.k.a. “chip” stocks, had been one of the weaker sectors in the initial July-August market selloff. However, one of the first signs of a change there came during the late-September re-test. While most areas of the market hit close to their August lows, or even undercut them, the chip stocks held well above, bottoming at the 61.8% Fibonacci Retracement of the August to mid-September bounce. Since then, they have led the way during the bounce. They are one of the relatively few sectors that has far surpassed its mid-September bounce high. Now comes the tough sledding, however.
While the semis have been leaders during this multi-week rally, it is still too soon to anoint them as such for more than just this short-term period. Why not? They still have too much in the way of challenges on the chart, in the longer-term. In other words, while the sector has been a leader over the past few weeks, it has not greatly improved its prospects over the longer-term. It cannot be confidently assumed that the recent bounce has paved the way for new highs in the sector vs. merely a strong mean-reversion bounce to a lower high within a range. In fact, there are not yet many market segments that have acquired the status of likely longer-term relative strength leader, based on their proximity to their former highs (we will touch on one such candidate tomorrow).
For the semiconductor sector, perhaps the first big test in achieving this likely longer-term leadership status has arrived today. Specifically, the PHLX Semiconductor (SOX) has run up into 2 key points of potential resistance around the 672 level:
- The 200-day simple moving average
- The 61.8% Fibonacci Retracement of its June-August decline
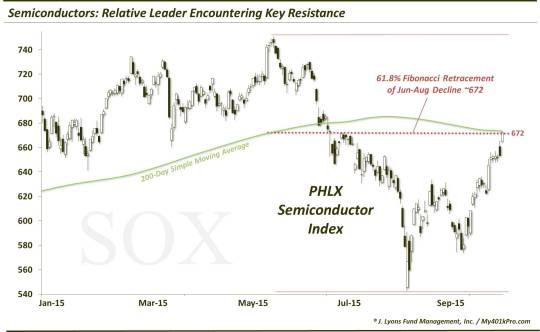
This area may be particularly tough to overcome in short order considering the magnitude and swiftness of the SOX’s October ascent. It should at a minimum take a breather in this vicinity before it is on its merry way towards its June highs. A further push above this 672-ish level in the near-term without a breather will likely further exhaust the index and produce a pullback eventually. Of course, a push higher straight back to its June highs would be the most bullish scenario, but highly unlikely.
If the SOX does pull back, a minimum retracement of 23.6% would bring the index down to a recent consolidation are around 652. That is also the present location of both the 200-day exponential moving average and the post-2012 UP trendline that the SOX broke below in August, but recovered this past week.
Regardless of the manner in which it does it, if the SOX can overcome the 61.8% Fibonacci Retracement of its post-June decline, there is hope that it A) can extend its rally in the intermediate-term, B) can assume a leadership role in a further broad market rally and C) is suggestive of a further market rally fueled by a healthy assortment of sectors achieving new highs as opposed to primarily a mean-reversion bounce to lower highs in most segments.
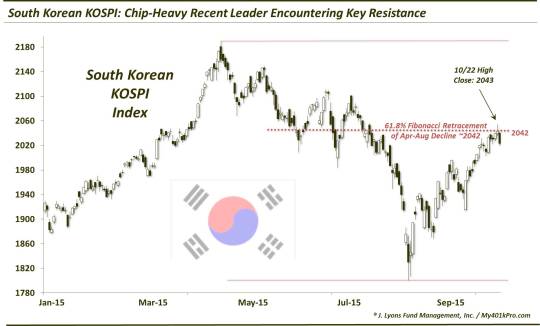
One potential confirming piece of evidence suggesting a semiconductor pause comes from a brother-in-arms index of the SOX: the South Korean Kospi index. The Kospi is heavily weighted by companies in South Korea’s prolific semiconductor industry. In a note of symmetry, the Kospi is also hitting the 61.8% Fibonacci Retracement of its April to August decline, around 2042.
One piece of evidence in the SOX’s favor has been the emerging leadership of its biggest component, Intel (INTC). Intel has overtaken its own 61.8% Fibonacci Retracement of its decline from December of last year to August. And while there are still hurdles above, including the approaching prior highs in May, the stock has cleared out a good amount of overhead resistance. This may aid in the SOX’s chances of continuing its climb higher.
Again, the PHLX Semiconductor Index has been one of the leaders in this October rally. That said, it has largely just regained much of the ground it had lost as it was leading the market lower in the June-August decline, Therefore, in order to prove this is more than a simple mean-reversion bounce, chip stocks have to overcome major hurdles on the chart so that they may make a run at their previous highs. If successful, they have a chance to assume a more meaningful leadership role and aid in the chances of another leg up for the broader market.
The first and perhaps toughest hurdle is facing the SOX as we speak.
_______________
More from Dana Lyons, JLFMI and My401kPro.
The commentary included in this blog is provided for informational purposes only. It does not constitute a recommendation to invest in any specific investment product or service. Proper due diligence should be performed before investing in any investment vehicle. There is a risk of loss involved in all investments.