Nasdaq 100 Facing Key Challenge For Stock Rally

The ability of the Nasdaq 100 to overcome nearby resistance would be one of the first price-based signs that the current stock rally may be more than just a mean-reversion bounce.
As swell as the stock market rally off of the late September low has been, it has lacked one crucial element thus far. None of the major averages, or even major sectors, have gone anywhere significant. Oh sure, many of them have bounced some 8%-10%, and that’s not chopped liver. However, none of the averages have surpassed any significant price levels beyond those representing a run-of-the-mill mean-reversion bounce. If the post-September bounce is to transition into something more meaningful on an intermediate-term basis, some of the major averages need to start breaking above levels of more consequence. One of the first indices with the opportunity to overcome such a challenge is the Nasdaq 100 (NDX).
The NDX has shown relative strength for most of the year. Thus, it wasn’t surprising to see the index hold well above its August low when the broader market retested the lows at the end of September. On September 17, the day of the Fed meeting and huge reversal that eventually led to the retest, the NDX was halted near a confluence of several key resistance points around the 4400 level. That level remains a key obstacle for the index, and perhaps a beacon of hope for the broader market should the NDX succeed in overtaking it. The index made its first foray above that line today since the September 17 Fed day.
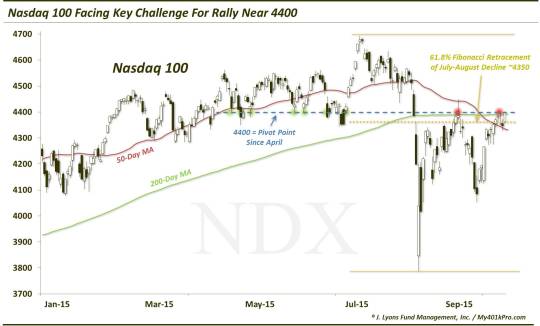
So what is so important about the 4400 level? Well, in our view, perhaps the most important charting analytic in that vicinity is the 61.8% Fibonacci Retracement of the decline from July to August. Markets tend to move in these consistent “Fibonacci” increments, as do many things in nature and other walks of life. The most important of the increments is the 61.8% retracement. If a market’s counter-move is only able to retrace 61.8% of a move, it is likely to be just a mean-reversion or dead-cat bounce.
A couple examples of this can be seen in just the past few months on the NDX chart. E.g., the “Fed day” bounce stopped right in this same vicinity, around the 61.8% Fibonacci Retracement of the July-August decline. Subsequently, the drop into the “retest” low in late September stopped right at the 61.8% retracement of the late August to mid-September bounce.
If the counter-move can go beyond the 61.8% retracement, it stands a much better chance of turning into a more substantial move, even moving beyond a 100% retracement. In this case, that would signify a new 52-week high in the NDX, above the July highs.
Now, based on the intraday low on August 24, the 61.8% Fibonacci Retracement of the July-August decline stands around 4350. The NDX closed comfortably above there today – and in mid-September, actually. Based on the exaggerated mini-crash prices on August 24, however, it is reasonable to assume the 61.8% line is much closer to the 4400 level. That is a subjective statement…but one based on much experience.
Also in the vicinity of the 4400 level is…4400 itself. This line has served as a pivot line since about April of this year. It held as support on multiple days in May, June and July. It then served as resistance in mid-September and again over the past week. Therefore, the line can reasonably be assumed to be support for prices above and resistance when prices are below it.
Additionally, the 200-day moving average sits at just under 4400. After holding above that line essentially since early 2013, the Nasdaq 100 finally fell below it during the August selloff. Again, on the Fed day, the NDX rallied above the 200-day intraday, but could not hold it at the close. Today, it was finally able to overtake it again, albeit slightly. Also, perhaps importantly, is the fact that the 200-day moving average has not yet turned downward. As bad as the recent selloff was, the 200-day has continued to move laterally, suggestive of sideways action rather than a trend lower.
Lastly, the index was able to recover the 50-day moving average in the past few days, which also lies in this vicinity. The 50-day also repelled the NDX on that September 17 Fed day. It has since fallen below the 200-day moving average, forming the vaunted “death cross”. But we’re not worried about that as long as prices can remain above those moving averages.
Today, the Nasdaq 100 closed at 4418, above the 4400 level, so it is a good start in meeting this challenge. Obviously, the next goal of the challenge is staying above that level. If it can, then the index can move convincingly above it. And if that is the case, there should also be more upside in the coming months for the broad market in general. For if one major index is able to break crucial resistance and prove it is involved in more than a simple mean-reversion bounce, it is a sign that there is legitimate demand still for stocks.
Thus far, no major indices or sectors have been able to move beyond “mean-reversion” status. If the NDX is able to win its challenge here at ~4400, it will bode well for it and for the continuation of the broader equity market rally.
_______
More from Dana Lyons, JLFMI and My401kPro.
The commentary included in this blog is provided for informational purposes only. It does not constitute a recommendation to invest in any specific investment product or service. Proper due diligence should be performed before investing in any investment vehicle. There is a risk of loss involved in all investments.