Use Discretion When Picking Consumer Stocks

A popular consumer discretionary ETF became one of the few major funds to return to all-time high territory yesterday. But are a few of the bigger caps masking broader weakness in the space?
We mentioned in yesterday’s post on the recent small-cap underperformance that at any given time in the market, there will be numerous causes for hand-wringing on the part of investors. Some of the concerns prove to be warranted, others do not. And some are valid – just not right away. Today’s Chart Of The Day likely falls into that latter category. Yesterday’s post noting the lagging small-caps brought into question the quality and level of participation during the most recent portion of the October bounce. The same questions may be raised regarding even some of the leading areas of the rally, like the consumer discretionary sector.
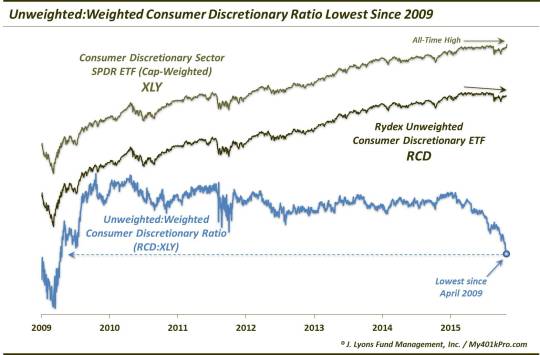
The ChOTD shows that the consumer discretionary sector, as measured by the popular cap-weighted ETF, the Consumer Discretionary Sector SPDR (ticker, XLY), closed at a new all-time high yesterday. That fact demonstrates the sector’s current leadership as it is one of the few areas of the market to return to new high ground following the July-September correction. All is not well in the sector, however.
The chart also shows the performance of the unweighted Rydex Consumer Discretionary ETF (ticker, RCD). Unlike the XLY, the RCD is still well off its all-time high, by some 5%. As a result of this dichotomy, the ratio of the unweighted RCD to the cap-weighted XLY has been trending lower – so much so that the ratio is actually at its lowest level since April of 2009!
So what are the dynamics at play here? It’s not too complicated. The XLY’s performance is being dominated by some of the larger stocks that represent a relatively high weighting within the fund. A peek at the ETF’s top 10 holdings and it’s easy to see why the fund has been performing so well.
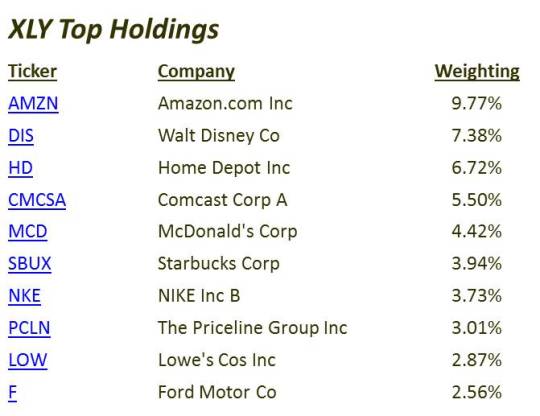
These stocks represent some of the trendiest (as in, “up”trend) and trendiest (as in, popular) stocks in the U.S. equity market currently (that shared distinction, by the way, is no coincidence as stocks that trend upward for an extended period will naturally rise in popularity as well.) Each of these 10 stocks is up between 10% and 20% over the past month. Additionally, with the exception of Disney and Ford (after today), each one of them is at or within spitting distance of their 52-week highs. Considering these 10 stocks alone count for 50% of the weighting of XLY, it’s no wonder the ETF is at all-time highs. The rest of the fund’s holdings would have to be doing extraordinarily poorly to counteract the positive contributions of these top 10 holdings.
While the impact of the balance of the XLY’s holdings is practically invisible, the performance of the RCD can give us a better clue as to the general performance of the rest of the XLY’s holdings and a better gauge of the overall heath of the sector. There are 88 stocks currently in the RCD fund. None of them have a weighting larger than 1.46%. Therefore, the performance of the RCD is a more accurate representation of the health of the overall consumer discretionary sector as it essentially portrays what the average stock in the sector is doing.
So what is the average consumer discretionary stock doing? Well, judged by the RCD’s performance, the average stock in the sector is still some 5% away from its previous highs. That is a far cry from the cap-weighted XLY’s position at an all-time high. It also tells us that, at least within this sector, there is much weaker participation within the October rally than the XLY would suggest. And while this situation may not immediately put the brakes on the recent rally, sooner or later it will become a problem (as it was eventually following our August 5 post on the same dynamic).
Does this mean investors should avoid the consumer discretionary sector altogether? No. It simply means that not all stocks, or funds, within the sector are the same. So use, er, discretion when selecting investments here – just as you would when selecting the products of some of these companies.
(Just try to choose the ones whose stock prices are going up!)
________
“Happy & Sad” photo by Farrukh.
More from Dana Lyons, JLFMI and My401kPro.
The commentary included in this blog is provided for informational purposes only. It does not constitute a recommendation to invest in any specific investment product or service. Proper due diligence should be performed before investing in any investment vehicle. There is a risk of loss involved in all investments.