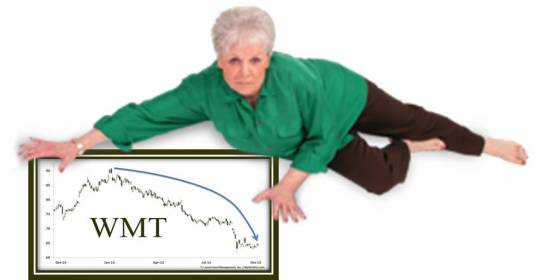
Wal-Mart Has Fallen & Can’t Get Up…But Support Is On The Way
Wal-Mart’s stock has fallen hard this year, with nary a bounce…however, a potentially major support level is approaching.
The damage in global equities during the 3rd quarter was obvious even to the most casual observer. However, below the surface, there has been an undercurrent of weakness throughout much of the year in many stocks (as we covered extensively in the lead up to the 3rd quarter meltdown). Of the mega-cap stocks, one of the worst performers (especially for a non-energy stock) throughout the entire year has been Wal-Mart (WMT).
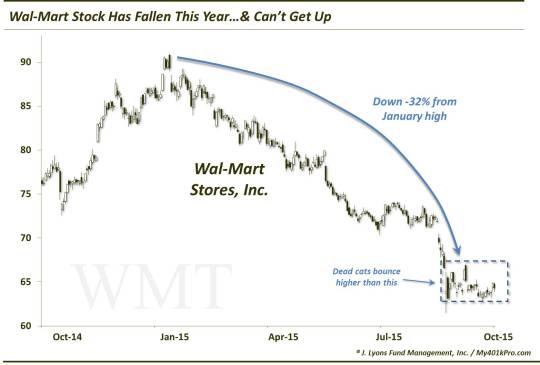
After recording an all-time high over $90 a share on the 5th trading day of the year, Wal-Mart began an almost uninterrupted plunge to a low of $61.50 on August 24. That’s a loss of -32% – and $100 billion in market cap – in less than 8 months. And as disturbing as that is, the stock’s reaction since is also disturbing.
Despite the spirited rally in the broad market off of the late-August crash lows, not to mention the bounce of the past few days, Wal-Mart’s stock has been unable to muster much of a bounce at all. After dropping nearly 30 dollars, the stock has bounced a maximum of…3 bucks, on a closing basis. As they say, dead cats bounce higher than that.
That lack of response after the free-fall brings the old Life Alert commercials to mind: “I’ve fallen…and I can’t get up!”. There is a rule on Wall Street that a stock that loses a third of its value, and is subsequently unable to sustain even a meager mean-reversion bounce is one to avoid. OK, there is no rule like that, but it should be common sense. One should not be surprised to see more downside in Wal-Mart in the coming weeks.
That said, help may be on the way…
All is not hopeless here, though. Wal-Mart’s stock may have pressed its emergency “HELP” button while lying on the ground down here in the mid-60′s. While another leg lower may be in the cards, it may be an abbreviated one. That is because, in our view, there appears to be major potential support on the chart near the $60 level.
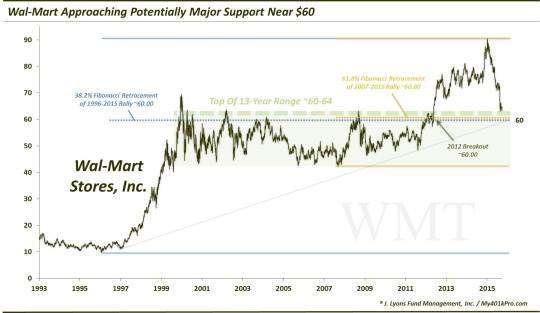
On what basis do we find potential support around $60 on WMT’s chart? During the late-1990′s bull market blowoff, Wal-Mart’s stock rallied from under $10 in 1996 to a high of $70 and a quarter on the final day of the decade. That would be the highest the stock would reach for the next 12.5 years. From 2000 to 2012, the stock would remain in a sideways range with the upper limit in the vicinity of $60 to $64 a share.
After breaking out for good above the 60 level in 2012, the stock rallied to over $90 earlier this year. However, as mentioned above, it has now pulled all the way back near that 60-64 level that market the top end of the 13-year trading range. Theoretically, that level should provide rock-solid support for the stock, at least temporarily.
That isn’t all, however. As you may know, we are fans of applying Fibonacci analysis to price structure. And in this case, probably the 2 most prominent Fibonacci levels on Wal-Mart’s chart currently each line up near the $60 level as well:
- The 38.2% Fibonacci Retracement of the rally from the 1996 low to the 2015 high sits near $60.00.
- The 61.8%
Fibonacci Retracement of the rally from the 2007 (range) low to the 2015 high sits near $60.80.
As we have said many times, when multiple important Fibonacci lines lie in the same vicinity, we can be more confident in their validity. This is especially true given that the lines are very close to the 13-year range top. Plus, for good measure, the UP trendline connecting the 1997 and 2011 lows is fast approaching that $60 level as well. It may seem like a freak coincidence that all of these key chart analyses would be aligned in the same vicinity. However, it should not be too surprising. Markets often (though, not always) display similar symmetry or order in their movements. You just have to locate these symmetries.
So Wal-Mart’s stock has fallen, hard. And it has yet to show any inclination to mount a significant rally. This inability to rebound from such a plunge is not a promising sign for the stock. Thus, we would not be surprised to see the stock embark on another fresh leg lower. That said, on a longer-term basis, there are a number of significant charting factors all lining up near the $60 area, not too far below current prices. This confluence of key levels, not the least of which is the top of the former 13-year trading range, should offer more than enough evidence to provide solid support for the stock.
If this level doesn’t support Wal-Mart’s stock, investors may want to skip Life Alert and just call in hospice instead.
________
More from Dana Lyons, JLFMI and My401kPro.
The commentary included in this blog is provided for informational purposes only. It does not constitute a recommendation to invest in any specific investment product or service. Proper due diligence should be performed before investing in any investment vehicle. There is a risk of loss involved in all investments.