India’s Bull Market Threatening A Key Support Level
The Indian stock market is threatening a support level key to maintaining its uptrend.
On September 11, we wrote a post titled “Indian Stocks Ready To Resume Bull Market?” At the time, the Indian S&P BSE Sensex Index was hitting what we determined to be the first critical support level since topping out in March (see our February 24 post “Indian Stocks May Be In For Breather After Banner Year”) The support consisted of 3 key Fibonacci Retracement levels from the major lows in 2009 and 2012 as well as from the 2014 breakout level. Each of the levels lined up in the same vicinity near 24,700:
- 23.6% Fibonacci Retracement of 2009-2015 Rally ~24,755
- 38.2% Fibonacci Retracement of 2012-2015 Rally ~24,571
- 61.8% Fibonacci Retracement of Rally from March 2014 Breakout Level ~24,756
As it happens, the Sensex did in fact bounce near the support level identified – at least for about 5 weeks.
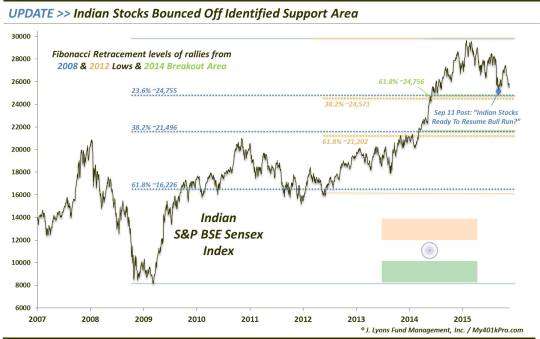
If you can see in the chart, the Sensex managed to rally about 11% off of the early September lows. However, as you may also notice in the chart, the index is again pulling back in the direction of those lows. Typically, this would be a normal, and even welcomed, development as a re-test of the initial low could provide for the placement of a stronger bottom. The only problem in this instance is that should the index continue all the way down to the previous low around 24,800, it would necessarily break another key level of long-term support.
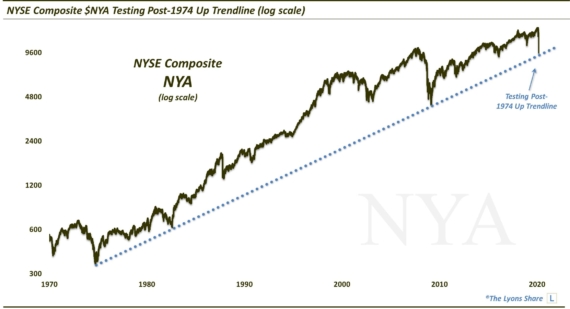
As the next chart shows, since 2003, there has been a well-defined UP trendline supporting the Sensex (on a log scale). The latest test of the trendline was at those early September lows. After the intermittent bounce, the index is again testing the trendline now.
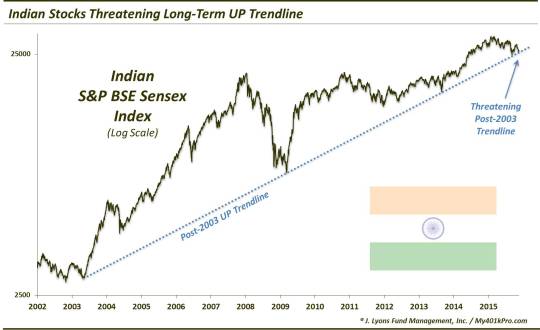
By our calculations, the post-2003 UP trendline presently sits at around 25,590. The Sensex closed today at 25,483, so the trendline is squarely under attack at the moment.
One factor working against the trendline holding this time is the frequency of recent touches. Prior to September, the Sensex had not touched the trendline in over 2 years. That fact increased the likelihood of the trendline holding. However, with two touches now in close proximity, there is greater danger of the trendline giving way. One way of looking at it is that the September touch of the line was only able to spur a shallow and short bounce. That suggests the trendline’s support influence is waning.
Should the trendline be broken, there may be a few mitigating factors in its negative connotation. First off, the Fibonacci support mentioned above now lies just below the rising trendline. Thus, there is support not too far away should the trendline give way. And, as we mentioned, a retest of those September lows would not be a terrible thing.
The other potential mitigating factor is that another (probably more) popular index – the Indian CNX Nifty Index – has a roughly 3% buffer before it hits its post-2003 UP trendline. By the way, that is close to the same distance that the Sensex is currently above its key Fibonacci support. Therefore, it is possible the Sensex could break its trendline and retest its September low while the Nifty simultaneously hits its post-2003 trendline – and then be on its way higher again.
That is not a prediction but one possible scenario. The point is that, while the trendline is key, there is a reasonable scenario whereby the trendline breaks but does not result in significant damage. Should the September lows and Fibonacci support give way however, the next support would be the subsequent sequential Fibonacci support levels in the lower 21,000′s. That is also the level of the 2008-2013 Sensex peaks that begat the early 2014 breakout to all-time highs.
Should the Sensex break the post-2003 UP trendline, it would certainly be a negative for the Indian bull market. However, with additional support not much lower on the index as well as on the Nifty Index, a trendline break may be short-lived. If those additional levels also break, a test of the 2014 breakout level may be in store for the Indian stock market. Such a test is likely an inevitability anyway at some point. But this would probably bring it about more quickly. Should that occur, the odds of a hold should be good – and perhaps provide the springboard to the next big up-leg in the secular Indian bull market.
________________
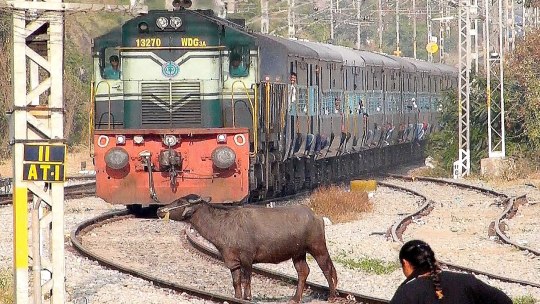
Photo of a bull on the tracks in front of an Indian Railways train from YouTube (he was fine).
More from Dana Lyons, JLFMI and My401kPro.
The commentary included in this blog is provided for informational purposes only. It does not constitute a recommendation to invest in any specific investment product or service. Proper due diligence should be performed before investing in any investment vehicle. There is a risk of loss involved in all investments.