Is It Too Late To Sink Your Teeth Into F.A.N.G. Stocks?

It would not be unprecedented for trendy issues like the F.A.N.G. stocks to continue on to much larger gains.
OK, full disclosure right off the bat: this post is not intended as a prediction, advice or even investment analysis whatsoever. It is simply a fun “what-if” illustration. As Bob #1 (or was it #2?) from the movie Office Space said “…believe me this is a hy-po-the-ti-cal “ (although, if the pattern shown below plays out over the next 18 months, we reserve the right to claim it was a prediction!).
Many of our posts over the past few months have harped on the narrowing breadth, weakening internals, etc. among stocks and the ultimate negative impact that trend is likely to have on the market. The other, positive, side of that coin, which we don’t touch on as much concerns those stocks that are still performing well. What the dwindling leadership does is make those still-positive stocks that much easier to identify. Most obvious among those in that shrinking category are the 4 affectionately referred to as F.A.N.G., i.e., Facebook, Amazon, Netflix and Google (Alphabet).
The median U.S. stock (as measured by the Value Line Geometric Composite) hit its high for the year in May and is actually down nearly 7% as of this posting. Meanwhile, the S&P 500, representing the leading style area of the market this year – large caps – is up about 1.5% on the year. Drilling down further, the segment carrying the load for the large cap gains is the Nasdaq 100, up over 10% in 2015. However, the entirety of the gains (more, in fact) in the 500-stock S&P index and the 100-stock Nasdaq index can be attributed to just the 4 F.A.N.G. stocks. Consider their respective gains for the year thus far:
- Facebook: +31%
- Amazon: +117%
- Netflix: +154%
- Google: +41%
While not reflected in the year-to-date averages, stocks have had a rocky go of it this year. Even the large-cap indexes experienced a serious scare in August-September. The F.A.N.G. stocks, however, have weathered the year relatively unscathed. The question is, can they continue to lead the major averages higher with fewer and fewer stocks assisting them? Perhaps making that task seemingly unlikely is the fact that, prior to this year, the 4 stocks had already experienced substantial gains in the past few years. Consider their gains since the middle of 2012, around the time they launched their current run:
- Facebook: +401%
- Amazon: +186%
- Netflix: +1503%
- Google: +133%
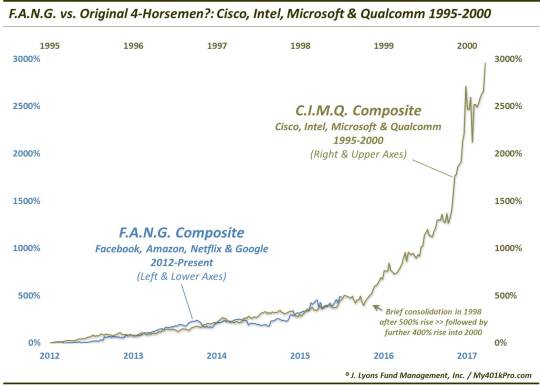
If one had constructed an equally-weighted composite of the 4 stocks, it would be up roughly 500% since 2012. It would seem far-fetched that the F.A.N.G. run could continue much higher after such gains. It would not be unprecedented, however. In almost any market era, one can pin-point such “trendy” momentum stocks that go to bubbly heights. One only needs to hark back to the tech stock bubble days of the late 1990′s to locate such a precedent.
There were many tech stocks that went parabolic in the late 1990′s bull market blow-off. 4 that stand out as perhaps the poster-children for the period (outside of the goofy dotcom startups like Pets.com) are Cisco, Intel, Microsoft and Qualcomm. We put together a composite of those four stocks
– lets call it C.I.M.Q. (I know, not as catchy) –
starting in 1995, the beginning of what we determined to be the blow-off period. Through about three and a half years into the middle of 1998, we see a familiar story. The composite was up roughly 500%, in line with the current F.A.N.G. over the same amount of time.
So, did the C.I.M.Q. stocks stop there? Unless you are under, perhaps 30 years of age, you know they did not. After consolidating for about 3 months around that time (i.e., the middle of 1998), the stocks exploded even further. The C.I.M.Q. composite would go on to quadruple from its already lofty heights over the next year and a half, before popping in 2000. A similar move by the F.A.N.G. composite would hypothetically take it from its current level around 600 to around 3000.
Here is the uncanny similarity between F.A.N.G. 2012-2015 and C.I.M.Q. from 1995-2000:
And for those wondering if the similarity is simply due to the distortion of the latter C.I.M.Q. move on the linear scale, here is a log-scale chart. The similarity is perhaps even clearer here:
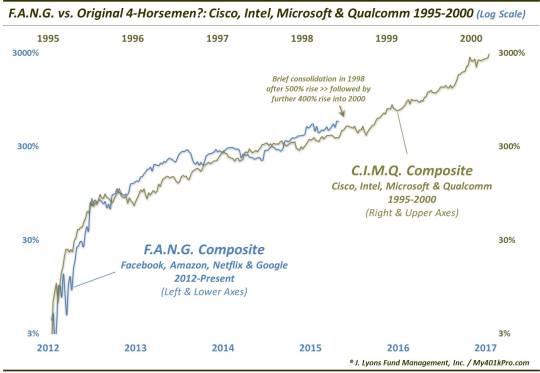
Now, in case the opening disclosure was not clear, let us make a few points:
- This a NOT our prediction of the future path of F.A.N.G. stocks.
- We do not HAVE a prediction of the future path of F.A.N.G. stocks.
- From any random period, one can likely find 4 stocks whose collective path mirrors that of 4 current stocks.
Regarding that last point, however: in this case, we spent zero time or effort in curve-fitting the stocks or the time period with which to compare the present-day F.A.N.G. phenomenon. The blow-off Nasdaq market from 1995-2000 was the most obvious period for comparison and the 4 stocks, Cisco, Intel, Microsoft and Qualcomm were the first 4 to come to mind in symbolizing that period.
We will add that we believe that period was in a different part of the market cycle than our present circumstances. That said, the similarities between the F.A.N.G. and C.I.M.Q. composites is unmistakable. And while the extent of the similarities is undoubtedly owed to simple coincidence, the general similarities should not be a shock.
That brings us to our basic takeaways from this whole exercise: no matter what time period one is considering, there will always be a select group of stocks du jour that will trend inexplicably higher. Furthermore, such trends, as most do, can carry further and longer than investors may originally think likely or possible. So, while we have no idea what will happen, is it possible that the F.A.N.G. stocks increase another 400% from current levels? It is possible.
Lastly, seeing as though it is Thanksgiving, we recognize that the “bears” have to eat as well. Thus, we present the “rest of the story” regarding the C.I.M.Q. comparison:
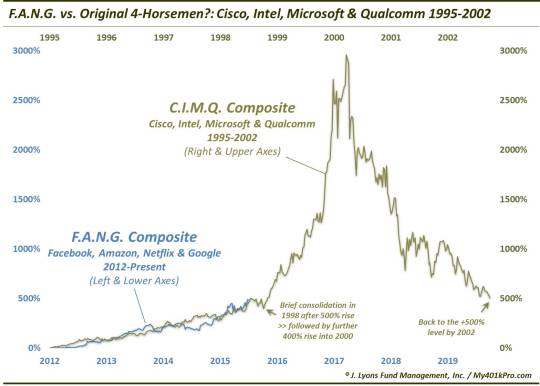
Happy Thanksgiving, everyone!
________
“Boy With Napkin Tied Around Neck Biting Into Turkey Leg” photo by H. Armstrong Roberts at allposters.com.
More from Dana Lyons, JLFMI and My401kPro.
The commentary included in this blog is provided for informational purposes only. It does not constitute a recommendation to invest in any specific investment product or service. Proper due diligence should be performed before investing in any investment vehicle. There is a risk of loss involved in all investments.
