Major Market Index Fails Key Test

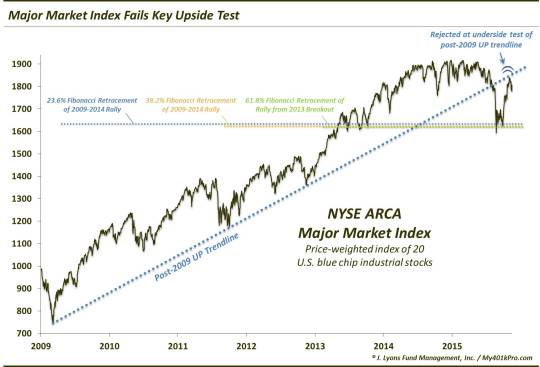
The blue chip Major Market Index failed to recapture a key breakdown level.
This post is about 2 weeks late, but still very pertinent in its message. We’ve written about the Major Market Index (XMI) on a couple occasions. Not widely followed, the XMI is an index of 20 of some of the largest blue chip industrial stocks in the U.S. market. While not a very broad index, it is influential, in terms of its constituents’ “name” recognition as well as their “weighty” impact on many of the averages.
The last time we posted something on the XMI was in June, taking note of a couple not-so-constructive developments on its chart. These would, of course, be a precursor to much greater weakness in the August-September decline. One of the key junctures during that period was the index’s early-August breakdown below its post-2009 UP trendline. That breakdown opened the gates to the steep losses later in the month.
Recently, amid the sharp post-September rally, the XMI returned to “kiss” the underside of the broken trendline. This was no happy reunion, however, as the result was a clear and precise rejection of price by the trendline.

What is the significance of this rejection? It simply suggests that prices will not return to the pace of advance that they enjoyed while they were above the trendline. It doesn’t necessarily mean that a new downtrend will begin in earnest. It could simply be that, notwithstanding the swift selloff following the August breakdown, prices could drift more or less sideways for some time. In fact, that may be the more likely outcome – should prices remain below the trendline.
We have been asked, given the relative obscurity of the index, what our rationale is for applying technical analysis to the XMI chart. Isn’t TA simply a self-fulfilling mechanism? Undoubtedly there is some of that. However, we do believe that there is a natural flow or pattern to prices, regardless of the amount of influence on the security by market participants. How else does one explain the post-2009 trendline with its perfectly conforming prices? Randomness?
Another piece of evidence to support the impact of Technical Analysis on a product like the XMI that has very little following is shown on the chart above. Readers may be familiar with our affinity for Fibonacci analysis in identifying potentially key levels on a chart. The accuracy of that analysis was evident on the XMI chart at its recent lows – even though few people are trading based off of it. The August low and September retest occurred in close proximity to the following key Fibonacci levels:
- The 23.6% Fibonacci Retracement of the 2009-2014 Rally
- The 38.2% Fibonacci Retracement of the 2011-2014 Rally
- The 61.8% Fibonacci Retracement of the January 2013 breakout-2014 Rally
So along with providing a helpful idea of the important support area to watch to the downside, the behavior of the XMI relative to key technical analysis guideposts suggests that there is some sort of non-random order to market price movements.
Importantly, on the upside, the underside of the broken post-2009 UP trendline should present a challenge to the pace and potential of any rally in the Major Market Index. If that is the case, given the big names in the index, it could present a challenge to other areas and averages in the market as well. It also indicates that, while the recent market strength has been concentrated in the large caps, that strength is not so widespread among the class.
With these blue chips running into a challenge nearby, not to mention their relative under-performance for most of the year, it appears that the leadership among the mega-caps is even thinner than folks think. How much longer can that choice few number of leaders continue to prop up the market? That is another six-million dollar question.
________
Photo of Lee Majors, the “Six-Million Dollar Man”.
More from Dana Lyons, JLFMI and My401kPro.
The commentary included in this blog is provided for informational purposes only. It does not constitute a recommendation to invest in any specific investment product or service. Proper due diligence should be performed before investing in any investment vehicle. There is a risk of loss involved in all investments.


