Saudi Stocks (& Oil?) Hanging In The Balance

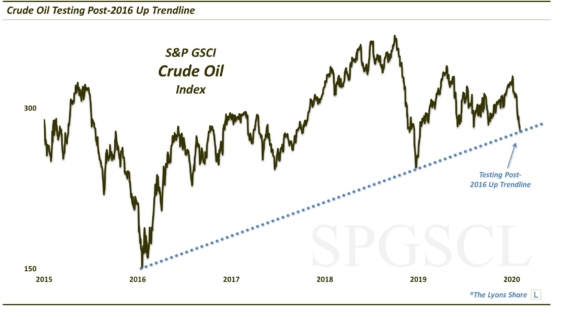
The Saudi Arabian stock market is testing key support; the resolution here will likely lead to a big move, up or down, for Saudi stocks – and perhaps oil.
We’ve written several times about the charts “predicting” the news. In other words, when a chart strongly suggests that certain price action is likely, we can guess what the resultant news headlines will look like should that price action actually unfold. And it is true not only for that market but also connected markets as well. One example of this was a post over a year ago regarding the stock market in Dubai. In our view, the chart suggested the Dubai market was vulnerable to perhaps a major decline. By extension, it stood to reason that oil might also experience a downside shock, if that decline took place. Well, Dubai stocks did plunge and oil cratered along with them as the commodity became front and center in the world’s financial news pages. This isn’t meant as a pat on the back for us – just an example of how a chart can tip one off to potential forthcoming news events.
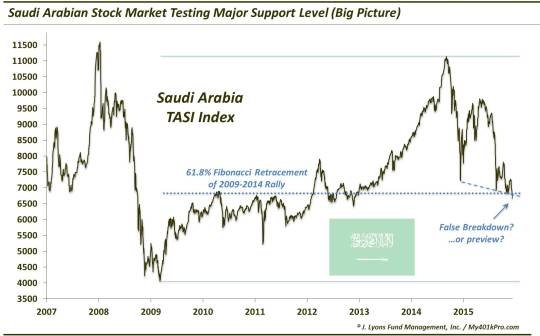
We bring up that example as we are seeing a similar development in the same region of the world – and the same commodity. The main stock index in Saudi Arabia, the TASI, is currently treading along a very key support level in our view. This level is represented by the 61.8% Fibonacci Retracement of the TASI’s rally from 2009 to 2014. Additionally, in the same area lies a support line connecting the multiple lows of the past 12 months.
Here is the big picture view of the TASI…
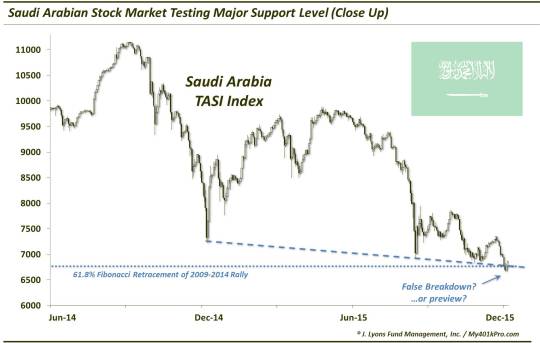
And the close-up…
In our view, this area around 6800 on the TASI is the kind of level that is capable of supporting a long-term low in the index. Thus, if it can hold here, the upside potential, over the long-term, is really limitless. Additionally, the pattern over the past 12 months can arguably be called a falling wedge. Not always, but more times than not, these patterns will resolve to the upside.
A few days ago, the index dropped below the key support, only to rally back above the following day. We often see that kind of “false breakdown” action in connection with important bottoms. That assumes the support level does not again give way. Such a scenario would certainly seem to bode well for oil as well given the obvious importance of the commodity to Saudi Arabia’s corporate world. And while you might say that suggestion amounts to the tail wagging the dog, the relationship is nonetheless very tight.
On the other hand, the fact that each bounce near the support line over the past 12 months has produced smaller and smaller bounces is a troubling sign. Yes, the falling wedge analysis may be valid, but prices do not always break up. And the more times this support area gets tested without producing a meaningful bounce, the more likely it becomes that the level will fail.
Should prices fail to hold the indicated level, there really is no recognizable support nearby that traders or investors can hang their hats on. In other words, should the level fail, it opens the TASI up for significant further downside – and perhaps quickly. In that scenario, it is obviously easy to imagine the price of oil declining sharply in concert.
Yes, that would be an epic development considering how far the commodity has fallen already. Given that oil has already matched essentially all historical precedents of “oversold” metrics, a further collapse from here would be an utter wash-out/crash type of scenario. We know there are a lot of forecasts out there for $20 oil, though we’re not sure how such forecasts are derived. Nevertheless, should this scenario unfold, perhaps the forecasters get their $20 oil price – or at least close.
You can imagine the news stories and headlines under this scenario. Furthermore, it is not hard to imagine resultant messages and policies that may come as a result of this scenario. Saudi Arabia would almost certainly change its tune to some degree in supporting the price of oil. And one can use their imagination to conceive of an extensive chains of events that would occur as a result of such developments.
And we could say we saw it all coming because of one measly stock market chart. Of course, it isn’t that easy nor are we predicting it. However, keep an eye on the key support level on the Saudi Arabian TASI. If it hold, Saudi stocks, and perhaps oil, can rally substantially. If it fails, then there is a chance that we witness a further deflationary spiral, and a wild chain of events that could come along with it.
_________
Photo of the tallest flag pole in the world (170m) in Jeddah City, Saudi Arabia from Wikimedia.
More from Dana Lyons, JLFMI and My401kPro.
The commentary included in this blog is provided for informational purposes only. It does not constitute a recommendation to invest in any specific investment product or service. Proper due diligence should be performed before investing in any investment vehicle. There is a risk of loss involved in all investments.