Semis Breaking Through Resistance?

Semiconductor stocks may be breaking above the layers of resistance we highlighted in October.
OK, we’re not talking about that kind of semi. Although, if semiconductor stocks can follow through on today’s breakout, they may run higher like a mack truck in the near-term. On October 22, we noted that the semiconductor, or “chips”, stocks “have been among the strongest sectors during the October stock market rally; however, the sector is now running into potentially stiff resistance.” For the sector to resume any meaningful leadership role in a market rally, it was our view that chip stocks, as represented by the PHLX Semiconductor Index (SOX) had to first overcome layers of resistance in its immediate vicinity. As we stated:
For the semiconductor sector, perhaps the first big test in achieving this likely longer-term leadership status has arrived today. Specifically, the PHLX Semiconductor (SOX) has run up into 2 key points of potential resistance around the 672 level:
* The 200-day simple moving average
* The 61.8% Fibonacci Retracement of its June-August decline
After a 1-day fake-out, the SOX did indeed succumb to the resistance posed by the area around 672 (from the post: “A further push above this 672-ish level in the near-term without a breather will likely further exhaust the index and produce a pullback”).
In the 5 weeks since then, the SOX has pulled back in a very healthy fashion. By that, we mean that the index has moved sideways to just gradually lower as it has worked off its “overbought” status. In doing so, the SOX has formed arguably a “bull-flag”, a tight consolidation pattern following a rally, which generally results in a breakout and further extension of the rally. Such a breakout may have occurred today.
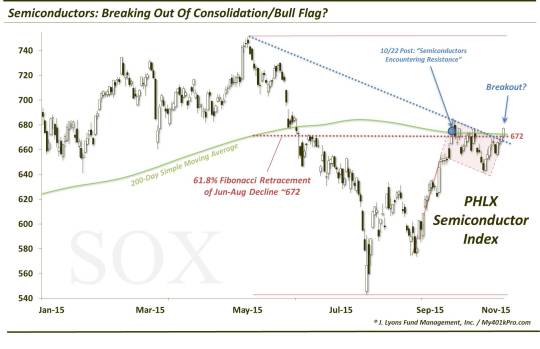
As the chart shows, today’s push to 677 lifted the SOX above both the 200-day simple moving average and the 61.8% Fibonacci Retracement of its June-August decline. And to boot, today’s close breaks a DOWN trendline extending from the June top across the tops of the recent consolidation/bull-flag.
Should the breakout be successful and the SOX follow through to the upside, the next “target” may be around 710-715, or about 5% above current prices. That area is marked by the 78.6% Fibonacci Retracement of its June-August decline as well as the breakaway gap down on June 26 which preceded the sector’s considerable weakness this summer.
We will note (subjectively) that the sector has been a tricky one at times to trade. It has been prone to bouts of whiplash as well as counter-directional moves versus the market (e.g., today when the SOX was up more than 1% while the S&P 500 was down a half of a percent). Additionally, we would have preferred a more definitive “3-wave” down move within the bull-flag. So it is possible that another wave down, in some fashion, may still be in the offing.
However, if the SOX is successful in maintaining its breakout level from today, look for the sector to potentially resume its leadership role that it held in the initial bounce off of the September lows. One further shot in the arm of the SOX could possibly come from its (by far) largest component, Intel Corp. (INTC). Like the SOX itself, INTC has tightly consolidated its strong burst off of its September low. In fact, INTC has been even stronger than the general sector and is closer to challenging its 14-year highs set a year ago. Of course, it too has to first break out above lateral resistance of its own.
With or without a breakout in INTC, however, the SOX’s move today suggests that another run higher may be in the cards for the chips.
_______________
More from Dana Lyons, JLFMI and My401kPro.
The commentary included in this blog is provided for informational purposes only. It does not constitute a recommendation to invest in any specific investment product or service. Proper due diligence should be performed before investing in any investment vehicle. There is a risk of loss involved in all investments.