Will 30-Year Trendline Put Cap On Oil Stock Drop, Or Lead To Another Gusher?

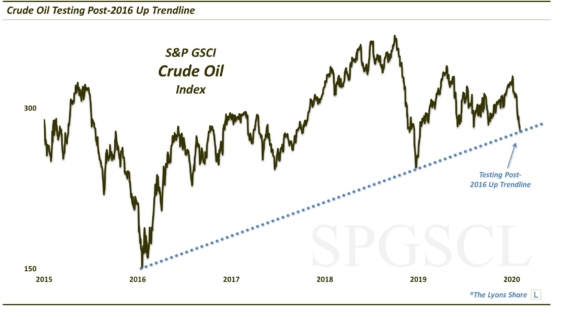
The post-1985 UP trendline could provide support for the XOI Index – but a break could accelerate losses.
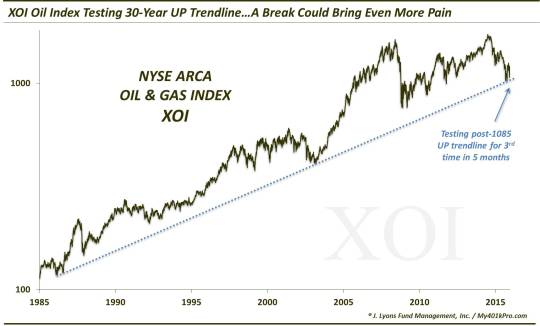
With oil and oil stocks at the forefront of the latest drop in global asset prices, investors are wondering where the beleaguered sector might find support. As it pertains to the stocks, the most widely followed benchmark has historically been the NYSE ARCA Oil & Gas Index, or XOI. Based on the XOI, oil stocks may be approaching a key support level imminently – or at least oil stock holders better hope it provides support.
What we’re looking at on the XOI chart (log scale) is an UP trendline originating in 1985, near the inception of the index and extending to the 2003 lows. The trendline is precisely where the XOI found support in August and September (another random event for the technically skeptical crowd). After the XOI’s bounce into November, it has come back down almost to the trendline once again.
This one’s pretty straightforward: if the trendline holds, it could provid the springboard for a substantial bounce. If the trendline breaks, losses in the oil sector could (gulp) accelerate even further. So which will it be?
On the one hand, a 30-year old trendline presents compelling impetus for support. On the other hand, the XOI tested the trendline relatively recently, in August and September. As we have mentioned before, when the frequency of trendline touches increases, the odds of the line breaking also increases. After bouncing at the line in 2003, the XOI went 12 years before touching it again in August. Another touch here would make it 3 in 5 months. Bulls would prefer the XOI bounce further off the trendline – and for longer.
Of course, in 2003, the XOI formed a similar pattern at the trendline. It formed a bottom/retest in January and February before coming back to test it again in March. It is fathomable that a similar pattern could unfold here. That is, the August-September pattern could be viewed as one complex test of the line and the current trip as the restest of that low. Just another possibility.
One more possibility to always keep in mind is the false breakdown. Should the XOI break down below the trendline, then recover it in short order, it could be a very bullish turnaround setup.
The application should be simple here, in our view. Above the trendline, the XOI has a chance to rally. Below the trendline, we would avoid it. Hypothetically, should the trendline break, the next support of substance comes in about 10% and 25% lower than current prices.
This situation brings to mind our June post on the XOI’s largest component, Exxon Mobil (XOM). XOM had been similarly supported by an UP trendline since 1987. In June, it broke the trendline. Within 2 months, the stock had dropped further by as much as 22%.
Contrarian oil stock bulls – or those who’ve been “stuck” in the sector for much of the downturn – should hope a similar break in the XOI does not take place.
________
Photo from the Dallas News.
More from Dana Lyons, JLFMI and My401kPro.
The commentary included in this blog is provided for informational purposes only. It does not constitute a recommendation to invest in any specific investment product or service. Proper due diligence should be performed before investing in any investment vehicle. There is a risk of loss involved in all investments.