BREAKING!: The Bull Market?

Today saw a slew of significant levels related to the post-2009 bull market break on several key stock indices.
Those of us who closely follow the stock market on a daily basis have a tendency to overestimate the importance of every little gyration. In reality, there are only a relatively few number of really key days in the market. These days are easily identified in hindsight, though, at times, we can sense their possible importance in real time (e.g., July 20 and August 24.) We bring this up because today had the potential makings of a key day in the stock market, in our view.
While the global markets were certainly volatile, a sense of the true consequence of today’s action is probably not gleaned from the popular indices like the S&P 500. Rather, let’s take a look at today’s developments via a few key indices that we monitor closely – and which we have mentioned several times in these pages over the past few months. Today’s potential price breakdowns among them threaten to undermine the sustainability of the post-2009 cyclical bull market.
1) Value Line Geometric Composite (VLG): The VLGC is an equal-weight index comprised of approximately 1700 stocks. It essentially tracks the median stock move in the market. As such, in our view, it provides the best assessment of the health of the broad U.S. stock market. And despite the fact that there are no VLG products actually trading anymore, it still adheres very well to most chart analyses.
On August 20, we noted the VLG’s break of its post-2009 Up trendline, a level we deemed “the most important line in the equity market”. Sure enough, the VLG would go on to lose another 7% over the next 3 days. In the late September re-test, the VLG managed to (barely) hold on to the next critical level around 435 on the chart, signified by a cluster of Fibonacci Retracements from the major post-2009 lows. It was this area that we called the “pass/fail” level for the U.S. equity market.
After a 1-day false breakdown in late September, the VLG reclaimed this area and launched into a month-long rally. In December, The VLG tested the level again, holding successfully again. Today may have brought the opposite result, i.e., a “failure” at that level.
The VLG closed today at 431. And while not a huge breach, the level is delineated precisely enough that we are confident that, as of now, this is a breakdown of the Fibonacci levels.
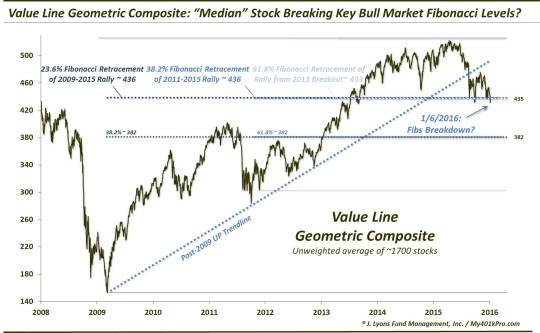
What does it mean? Besides opening up potentially 12% of downside to the 382 area, it would signify a lower low on the chart. Lower highs and lower lows would signify a downtrend for the majority of stocks, threatening the extinction of the post-2009 bull market.
2) Value Line Arithmetic Index (VLA): Like the VLG, the VLA is an unweighted average of ~1700 stocks, taking the mean change among them. In December, we pointed out that the VLA was testing its post-2009 Up trendline. It was able to hold that area successfully then. Now, not so much.
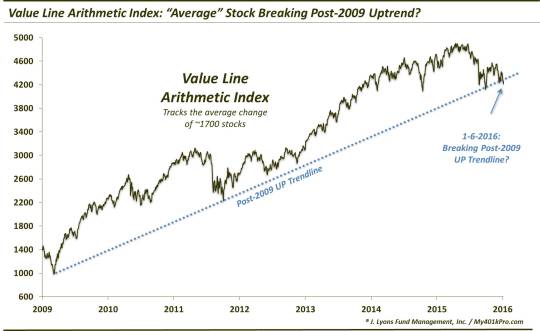
Today saw the VLA close below its post-2009 Up trendline. While it is still above its corresponding 1st set of Fibonacci Retracement levels, this is a serious break of a support line that has been in place for nearly 7 years. The VLA is also closing in on its September lows, threatening a series of lower highs and lower lows here as well.
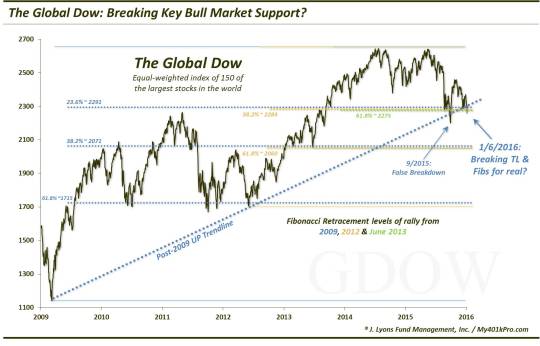
3) The Global Dow: The Global Dow is an unweighted average of 150 of the world’s largest companies. Thus, it provides a decent barometer of the global equity market. We have been closely tracking the Global Dow for the past 8 months as each significant development on its chart has been a consistent harbinger of what was to follow.
The Global Dow has been a hybrid of sorts of the 2 Value Line indices. It has threatened, but held, its post-2009 Up trendline several times since August (notwithstanding a brief false breakdown at the low in September. Additionally, it has held its well-defined post-2009 Fibonacci Retracement cluster, which has corresponded closely with the trendline over the past month. All of that has now gone by the wayside as the Global Dow broke below all of those levels today.
This does not guarantee a collapse by any means. But again, crucial levels that have served as support for the post-2009 bull market have been broken. Lower highs and lower lows are emerging. If you’ve been waiting for proof in the way of failing prices to consider the possibility that this bull market is in jeopardy, you now have solid evidence.
But…of course there are no guarantees of anything in these markets, in particular with the rash of false breakouts and breakdowns in recent years. If prices can reclaim these broken levels in very short order, i.e., in the next few days, perhaps a false breakdown can serve as a springboard for a nice bounce. That said, the indices above have already seen their share of tests and false breakdowns. Eventually, that will wear the key levels thin and leave them susceptible to a legitimate breakdown. That process may very well be in the works.
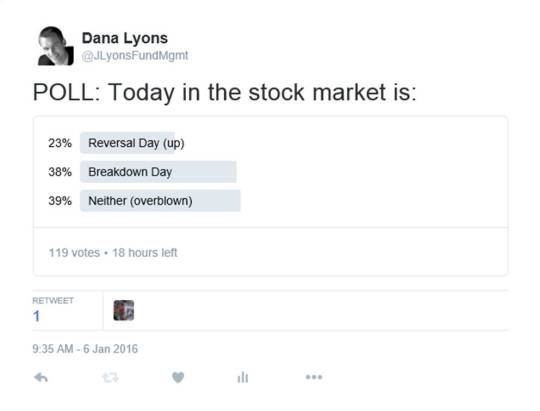
Lastly, was it a “key day”? We identified the likelihood of that possibility early this morning. But what did others think? Well, we took to Twitter to see what others thought. Here were the results of our poll:
________
More from Dana Lyons, JLFMI and My401kPro.
The commentary included in this blog is provided for informational purposes only. It does not constitute a recommendation to invest in any specific investment product or service. Proper due diligence should be performed before investing in any investment vehicle. There is a risk of loss involved in all investments.