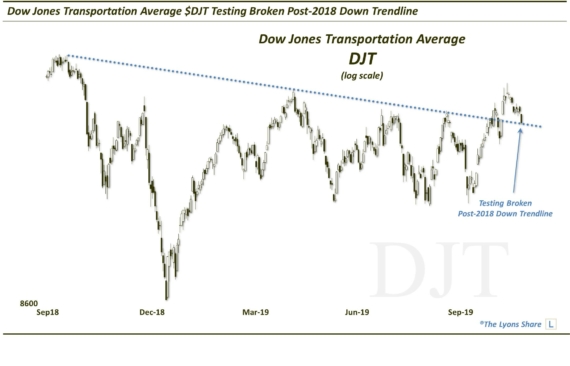
Chart Pattern Flagging A Warning For Transports?
The nature of the bounce in transportation stocks over the past month suggests a potential re-test of the January lows.
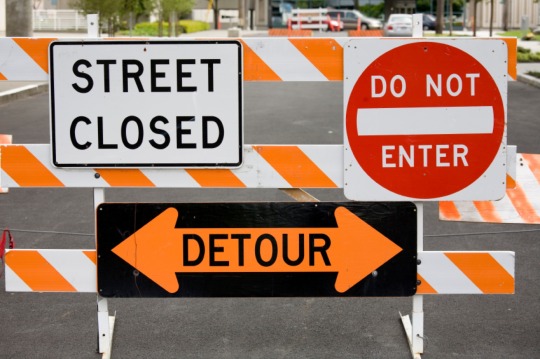
Back on January 21, we published a post titled, “Transports Can’t Afford To Travel Any Lower”. As the title suggests, the point of the post was that transport stocks, as measured by the Dow Jones Transportation Average (DJT), had plunged to a level that should serve as substantial support. And if it did not, then we were talking about disorderly, crash-type risk potential. Fortunately for these vehicles, they heeded the sign and avoided any (further) “crashiness”. The nature of the month-long bounce since, however, has us concerned that the DJT may be running into a roadblock here soon, at least for the near-term.
Why do we say that? We have often times talked about judging the “quality” of a rally, especially following a significant decline. The quality, which includes metrics such as the breadth and the pace associated with the advance, can give a clue as to the type of rally it might be. For example, does it appear to be merely a dead-cat bounce or potentially a major reversal, etc. In this particular instance, it is the pace of the advance – or lack thereof – that has us skeptical about the immediate sustainability of the bounce.
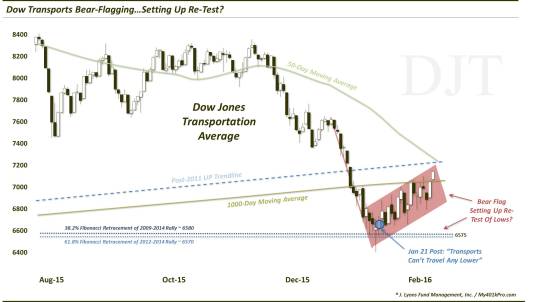
We’ve spoken about “bear flags” on the blog a number of times. These occur when a bounce in prices unfolds in a much more shallow, tepid manner than the pace of the preceding decline. In these cases, the bear flag patterns typically take the form of “continuation patterns”, i.e., prices eventually “continue” in the direction they were originally headed (down). In our view, the chart of the DJT has the “look” of a bear flag.
Up trendline
Notice the angle of ascent during the rally of the past month or so (the area shaded in red). In 17 days, the DJT has gained 6.4%. You might think that’s pretty good, especially considering the fact that many indices during this time were actually down, or close to it. That’s a fair point and it may bode well for stocks over the intermediate-term. However, in the near-term, here is why we are concerned: prior to the bounce, it took the DJT just 8 days to drop that same 6.4% (and nearly did it in just 5 days).
Therefore, the pace of the advance has paled in comparison to the prior decline. This sets up a potential “bear flag”. Thus, we are cautious regarding the potential for a swift drop that breaks the uptrend encompassed by the bear flag pattern in red. How do we know when the bear flag will stop? While we can’t know for sure, there is evidence that the bounce could run out of steam soon in the form of the following areas of potential resistance just above 7200.
- The declining 50-day simple moving average
- The flattening 1000-day simple moving average
- The 23.6% Fibonacci Retracement of 2014-2016 decline
- The 38.2% Fibonacci Retracement of November-January decline
- The underside of the broken Post-2009 Up trendline
The resolution of such a break could set up a re-test of the January low which occurred at the following key levels.
- The 38.2% Fibonacci Retracement of 2009-2014 Rally ~6580
- The 61.8% Fibonacci Retracement of 2012-2014 Rally ~6570
Assuming such a re-test takes place, a hold at that level could produce a more durable rally than what unfolded over the past month, i.e., an intermediate-term advance spanning up to several months. Of course, the quality of the advance would have to be judged just like the present one. However, we would expect that an intermediate-term rally would be possible, within the context of a developing cyclical bear market.
First things first, however – transport stocks need to get past this bear flag of a roadblock.
__________
More from Dana Lyons, JLFMI and My401kPro.
The commentary included in this blog is provided for informational purposes only. It does not constitute a recommendation to invest in any specific investment product or service. Proper due diligence should be performed before investing in any investment vehicle. There is a risk of loss involved in all investments.