A Really Big Stock Index Is Hitting Resistance

The broadest U.S. stock index has reached an area of significant potential resistance.
This will be our last in a series on major U.S. stock indices encountering areas of potential key resistance on their charts – any more would really be redundant. The post-February rally has been impressive in its breadth and pace. One by one, however, the averages have been reaching levels on their respective charts that, in our view, represent significant potential areas of resistance. That includes small caps, big caps and, as we point out in today’s Chart Of The Day, a big index.
The Wilshire 5000 is the broadest index of U.S. stocks. In fact, it cannot get any broader as it encompasses all actively traded stocks in the United States. The index was dubbed the Wilshire 5000 because that was the approximate number of issues trading at the time of its launch in 1974. However, as of June 30, 2015, the index contained 3,691 issues (though, it has retained its name as “Wilshire 3691″ does not have the same ring to it). Although the index is market cap-weighted, its value as a gauge of the broad stock market is obvious.
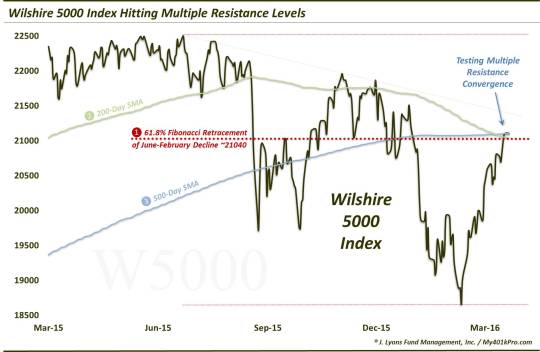
As mentioned, like prior indices we’ve looked at, the Wilshire is presently hitting an area encompassing several points of potential resistance on its chart, including:
- The 61.8% Fibonacci Retracement of the June-February decline
- The 200-Day Simple Moving Average
- The 500-Day Simple Moving Average
As we’ve discussed in recent posts, these potential price resistance levels are not assured of stopping, or slowing, the rally. They are merely chart analyses that we have found consistent, or at least useful, in the past at highlighting support and resistance levels. What makes the potential resistance argument compelling is A) the abundance of potential resistance points converging nearby on the charts, and B) that it is an almost universal condition among all the major indices.
Outside of some of the smaller-cap indices that we noted several weeks ago, today brought the first inkling of weakness among most of the stock averages. Time will tell whether today’s selloff is the precursor to a real cannonball shot to the gut of the post-February rally, or merely a glancing blow. The cannonball scenario probably should not be dismissed, however, since the weakness is occurring from the right price levels.
________
Video is of Frank “Cannonball” Richards whose on-stage specialty was getting struck extremely hard in the stomach through various means (apparently, he limited the cannonball shots to two a day because it was too painful).
More from Dana Lyons, JLFMI and My401kPro.
The commentary included in this blog is provided for informational purposes only. It does not constitute a recommendation to invest in any specific investment product or service. Proper due diligence should be performed before investing in any investment vehicle. There is a risk of loss involved in all investments.