The Line In The (Oil) Sand
The current test of a 30-year trendline could determine whether or not the bounce in oil stocks is sustainable.
What do all the inquiring minds want to know right now? Is the bounce in energy stocks for real? Analysts, pundits, gurus, oil tycoons and social media macro tourists all have an opinion on whether oil and oil stocks have bottomed and are on their way to boomtown again…or are in the midst of a dead-cat bounce, destined for the dusty plains of new lows. While they’re busy pouring over economic data out of China, storage reports and rig counts, parsing words out of OPEC and handicapping the U.S. presidential race for clues, we wonder, what if it merely comes down to a single line drawn on a chart?
Ah, technical analysis…we can hear the groans, not to mention the “simpleton” and “voodoo” callouts. Whatever. Drawing lines on a chart may have its flaws and drawbacks. But, I know 2 things for sure: 1) it can help objectively define the price at which one is right or, importantly, wrong on a position and 2) it is vastly more accurate than the litany of variables above. Especially if one has the correct line. And we think we have a good one, as it pertains to oil stocks.
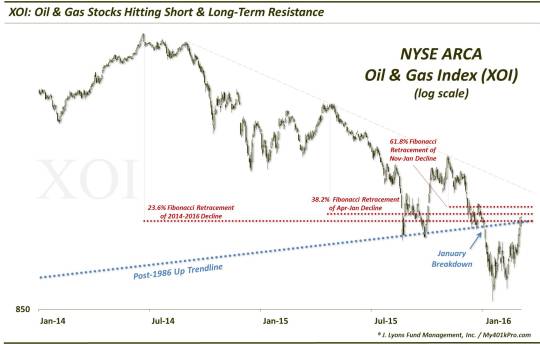
Using a log scale chart of the most popular oil stock index, the NYSE Oil & Gas Index, better known as the XOI, we note an up-sloping trendline that has been intact for almost its entire existence. The trendline precisely connects the lows in July 1986, January-March 2009 and August-December 2015. On January 6 (remember that date?), the XOI broke the trendline for the first time, subsequently falling another 15% into the January 20 low (remember that date?).
Since then, the XOI has bounced all the way back and is presently testing that breakdown area.
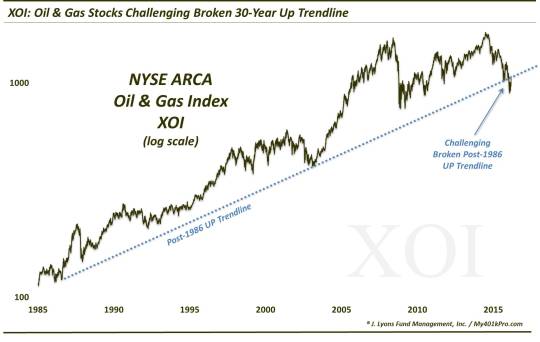
If the XOI can reclaim that broken trendline, perhaps it can once again serve as support for the oil stock index as it did for 30 years. Not to mention, it would look like a compelling “false breakdown”. These factors could serve as a springboard to a major, sustainable rally in oil stocks.
Of course, should it fail here, it would confirm the January breakdown and further cement the trendline as new found resistance. It would then need to search for a new price catalyst to spark a rally, a difficult prospect when prices are probing 6-year lows.
If you have a difficult time with the concept that prices could have “memory” going back 30 years (btw, ask Exxon Mobil investors what happened once the stock broke its 30-year trendline back in June), well, the XOI is also dealing with some potential resistance levels on a shorter-term basis. Besides the January breakdown point (which occurred at the 30-year trendline), there is a close confluence of Fibonaccii Retracement lines from recent highs, specifically:
- the 23.6% Fibonacci Retracement of 2014-2016 decline
- the 38.2% Fibonacci Retracement of April-January decline
- the 61.8% Fibonacci Retracement of November-January decline
It is not shown on this chart, but the XOI did pull back from this area by more than 4% today. So, whether one thinks of this analysis as voodoo or over-simplified or whatever, there are some chart lines that it just may pay to keep in mind – literally.
This 30-year line in the sand for oil stocks is one of them.
_____________
More from Dana Lyons, JLFMI and My401kPro.
The commentary included in this blog is provided for informational purposes only. It does not constitute a recommendation to invest in any specific investment product or service. Proper due diligence should be performed before investing in any investment vehicle. There is a risk of loss involved in all investments.