Indian Stocks At A Crossroads

The resolution of the Indian stock market’s current test of resistance could set the stage for either a run at all-time highs, or a test of the 2014 breakout area.
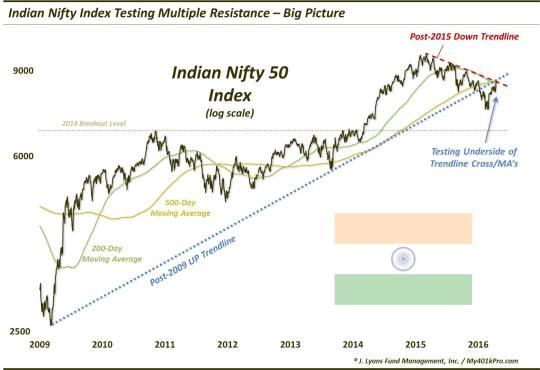
On March 7, 2014, we highlighted the fact that the Indian stock market was breaking out above a 6-year series of peaks to an all-time high. It would proceed to rally more than 40% over the next 12 months. In February of last year, we noted that, based on various charting analyses, the rally in “Indian Stocks May Be In For A Breather”. Indeed, on March 4, 2015, almost exactly 1 year following the breakout, the rally ran out of gas. The Indian market would proceed to trend lower for the next 12 months before bottoming (at least in the near-term) on February 29, 2016 – almost exactly 1 year after it peaked.
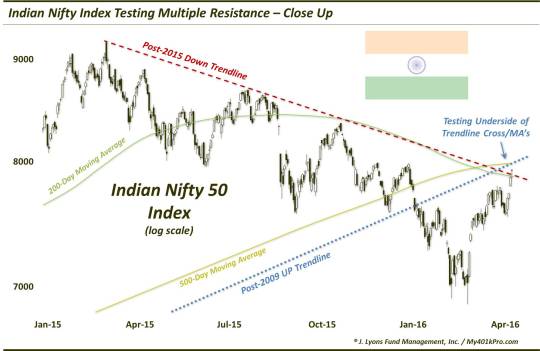
Fast forward to today and we see that the Indian stock market has bounced along with most of the global equity markets. Also like most markets, the Indian market (as represented by the Nifty 50 Index in the charts below) has reached an area on its chart containing multiple levels of potential resistance. Among others, these potential areas of resistance include:
- The underside of the broken post-2009 up trendline
- The post-2015 down trendline
- The 200-day simple moving average
- The 500-day simple moving average

A closer look:

The reaction of the Nifty at this juncture could determine whether this post-February bounce has any more legs to it – or whether it has run its course. We never want to anticipate a breakout so the benefit of the doubt should go to the bears and this resistance holding. However, should this convergence of resistance be overcome, the bulls would quickly regain the ball.
Lastly, we do not want to overstate the importance of this current test of resistance. However, the decision at this crossroads could set the stage for the next move of an even greater magnitude. We have mentioned a number of times the not unlikely chance that, at some point, the Indian stock market will return to test the 2014 breakout levels. There certainly is no rule that price has to test that breakout point, but these levels tend to act like a magnet, often inviting at least one test before a more durable advance.
Therefore, should the Nifty fail at current resistance, that may put a test of the breakout level in its sites. And while that may seem like a dire outcome, the breakout level is only about 5% below the February lows. So it is certainly a conceivable destination.
On the other hand, should prices surmount these areas of resistance, not only are the short-term rebound prospects enhanced, but the bigger picture improves greatly as well. We view the Indian market as being in a secular bull market and merely undergoing a post-breakout breather. It wouldn’t be a sure thing, but a breakout above resistance here may suggest that the breather is over. And in that case, an assault on the all-time highs, and beyond, may not be far behind.
For now, we’ll just take it a step at a time. A breakout above nearby resistance and the bulls have the upper hand. A failure here, and the bears still have the ball.
_________
Photo of Grand Trunk Road, Kolkata, India from Steve McCurry’s Blog.
More from Dana Lyons, JLFMI and My401kPro.
The commentary included in this blog is provided for informational purposes only. It does not constitute a recommendation to invest in any specific investment product or service. Proper due diligence should be performed before investing in any investment vehicle. There is a risk of loss involved in all investments.


