Are Net Stocks Gearing Up For One More High?

The internet sector, one of this bull market’s leaders, may be poised for one more new high.
Last July, we began to note the severe thinning out of the bull market in stocks. As more and more areas of the market began to break down, there were fewer stocks left pulling the weight of the averages higher. It eventually reached the point that there were apparently so few stocks still participating in the rally that they could all be lumped into an acronym. Given that at least 2 of the famed F.A.N.G. stocks, and arguably all 4 of them, fall under the internet umbrella, it is no wonder that the sector has been one of the bull market leaders. That has especially been the case in recent years, as we’ve noted in these pages several times during their run. Even when volatility began to kick up last August, the internet sector remained fairly resilient. And when the dust settled in late September, we noted that the internet stocks were poised to move higher again.
The net stocks did indeed move higher through the end of the year. However, when the broad selloff accelerated in early 2016, the sector was not immune. By early February, judging by a popular ETF, we declared that even the market generals, i.e., the internet stocks, were being taken out. As it turns out, that was 3 days before the market bottomed. As such, the death of the internet sector proved to be greatly exaggerated.
We bring this up now because the market appears to be at a bit of a crossroads. The major averages bumped up against their former highs and were rebuffed. And many of the bullish developments that we have been noting since the February bottom have either run their course or have become less inspiring. Through it all, however, one sector that has been a rock in recent years (outside of the defensive leaders) continues to display potentially positive behavior: the internet sector.
Why do we say this? It is strictly based off the charts. Specifically, looking at the Dow Jones U.S. Internet Index, we see a potentially positive – and familiar – pattern. Since the August and September lows of last year (when we wrote the aforementioned bullish post), the Internet Index has traced out a series of horizontal highs and ascending lows. In charting parlance, this can arguably be construed as an “ascending triangle”.
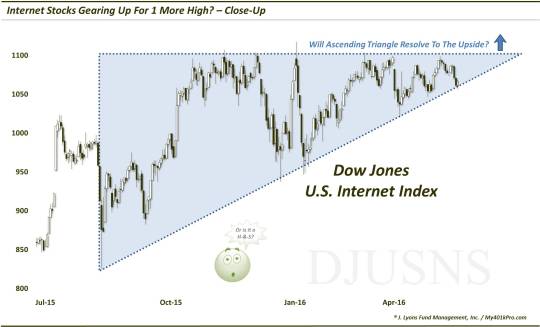
An ascending triangle, theoretically, indicates a situation of stagnant supply and increasing demand. While sellers continue to protect the top of the range, buyers demonstrate more urgency as they continue to buy up shares before prior lows are reached. Thus, demand would appear to be winning the battle versus supply. And historically, this pattern has a tendency to see prices resolve themselves to the upside out of the pattern. That is, they tend to break up over the resistance represented by the top of the triangle.
While we are loathe to set “price targets”, the potential further upside upon an ascending triangle break is generally thought to equate to the height of the triangle. In this case, one would take the difference between the top of the triangle, near 1100, and the bottom of the triangle – in the mid-800′s, near the August or September lows. Thus, the difference (about 250 points, or about 30%) may be added to the top of the triangle for a potential target near 1350-1425 (or about 25%-30% above the top of the triangle).
Why do we say this is a familiar pattern? If we zoom out a bit, we see a couple more instances (arguably) where the Internet Index traced out ascending triangles since the beginning of the post-2008 rally.

First off, the 2008 low began the formation of a massive, nearly 4-year ascending triangle. The tops of the triangle lay in the mid-400′s, essentially doubling up the 2008 triangle bottom. And true to form, once prices broke out above the top of the triangle in 2012, they went on to double again over the next year and a half.
The initial pullback from that rally peak in early 2014 set the anchor for the next ascending triangle. This one lasted about a year and a half leading up to the breakout last summer. Again, the post-breakout rally of about 22% essentially matched height of the 2014-2015 triangle.
So here we are again with seemingly the same pattern. Time will tell if it follows suit or ends up being a bust this time. One thing we always like to do is look for holes in our analysis or hypotheses. So what are some pitfalls that may turn this pattern into a bust?
First, for those who may not follow market cycles, it is very common for a cycle to move in 3 waves. In this case, the move up from the 2008 low may be construed as the first wave while the 2 triangle breakouts would mark waves 2 and 3. If so, the cycle may have run its course already. Even so, however, that would not preclude the Index from making a marginal or temporary new high before breaking down, i.e., a false breakout. Then again, the 2 existing triangle breakouts may account for waves 1 and 2 and the hypothetical breakout of the current triangle would finish the cycle with the 3rd wave.
Another potential negative deals with the intra-day spike higher and reversal on February 2 of this year. If we’re going to rely heavily on intraday data and candlesticks, then we suppose one could interpret the pattern as a head-&-shoulders, with February 2 marking the head. This is predominantly a bearish pattern and a break lower would be its presumed outcome.
Of course, this will all be hashed out by price movement. The index could break down tomorrow below the post-August 2015 up-sloping triangle bottom and resolve the pattern to the downside. That would be all the analysis and pontificating one would need.
However, we often preach (and are often reminded) to stick with the trend. And the post-2008 rally in internet stocks has been one of the more consistent and reliable trends in the equity market – and still has done nothing wrong. Thus, while the broad market deals with its considerable issues, internet stocks appear to be potentially poised to make at least one more run higher.
_____________
More from Dana Lyons, JLFMI and My401kPro.
The commentary included in this blog is provided for informational purposes only. It does not constitute a recommendation to invest in any specific investment product or service. Proper due diligence should be performed before investing in any investment vehicle. There is a risk of loss involved in all investments.

