European Bank Stocks On The Ledge

Already plumbing multi-year lows, European banks are threatening to fall off another chart “cliff”.
We have written several posts regarding the significant challenges that face U.S. bank stocks from a technical perspective (see our May 21 post, “Rate Hike? This Chart Says Don’t ‘Bank’ On It”). However, their struggles pale in comparison to their counterparts across the pond. There has been quite a bit of focus on the European banks’ positioning at the epicenter of global economic financial risk, whether it’s loan exposure or derivative exposure. We’ll let others debate that issue and stick to the technicals. Unfortunately, the charts would appear to fully match the cautionary exposure rhetoric.
Taking a look at the STOXX Europe 600 Bank Index, we see that today’s intraday low nearly matched the February 11 correction low. The index was able to bounce off of those lows a bit by the close. This is fortunate as it would have signified a 4-year closing low. Furthermore, it would have threatened a 7-year Up trendline that has been in place since near the 2009 lows.
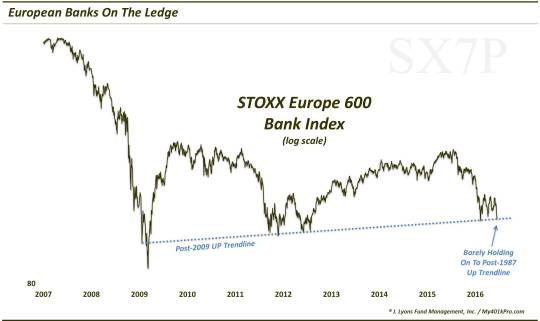
You might wonder why our trendline begins at the January 2009 low, instead of the March 2009 undercut low. Is that cheating? We don’t have a problem taking some liberty with trendlines as long as one is being intentional about finding the best-fit line. After all, it is called a “trend”-line. Thus, if the best-fit line happens to slice through a temporary blip, so be it, if it is the best representation of the trend. We believe that is the case here.
Notice how the trendline precisely held the lows in September and November 2011, June and July 2012 and February of this year. Again, the index is presently testing the trendline today. Whether it holds again is to be determined. However, the index’s inability to mount a significant bounce off of the line since the February touch and the April near-touch is cause for concern. We have noted before that an increased frequency of touches of support, resistance, trendlines, etc. is often a sign that the level is due to be broken. That would be a high-odds bet here.
Thus, the February-June formation has the look of a continuation pattern, i.e., prices should eventually continue in their previous direction – down, in this case. How far down? As we have often repeated, we are not fans of setting targets, but rather of following price and responding to it according. However, a rough guide in this case may be to expect another down-leg of a similar magnitude to the initial down-leg from last July (~228) into the February low (~130). That decline equated to approximately 43%. Thus, a similar sized decline from the recent high might bring prices down below the 90 level, or some 31% below current levels.
In any event, a drop off of the current cliff would not be a good thing. Unless it ushered in a quick wash-out and reversal back above the trendline. Such an event may represent a false breakdown and provide the impetus for a durable reversal. However, given some of the characteristics that we mentioned, this chart does not have the look of a potential false breakdown. Furthermore, it is likely too early in the decline to expect a major low to be put in.
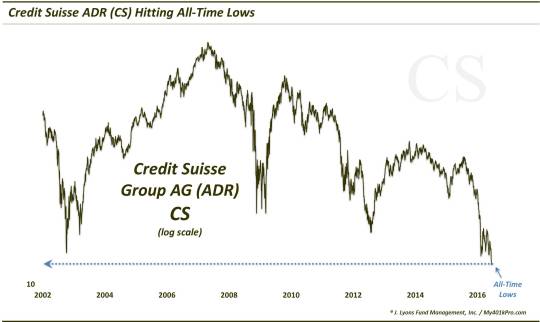
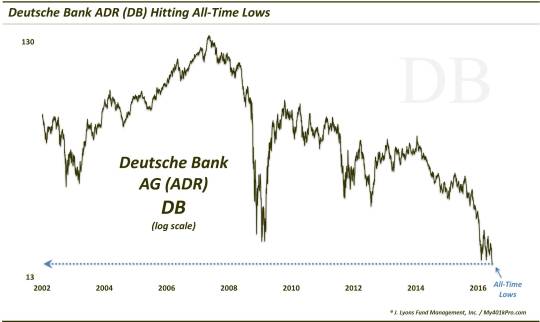
Lastly, as a bit of a warning for those that are skeptical about how much further prices can fall, consider the charts of 2 of Europe’s largest bank stocks. Technically, these are the banks’ ADR’s so they’re priced in U.S. Dollars. However, even in Euros, they are trading at all-time lows.
Credit Suisse
Deutsche Bank
It goes without saying that European banks have been mercilessly taken to the woodshed. However, we would caution one from getting too eager to catch the falling knife just because it is down “a lot”. The reality is that the cycle decline may be as close to the beginning (i.e., July 2015) as it is to the end. So, this is not a recommendation, but if I owned these assets, I would be praying for a 5%-10% bounce that challenged the broken post-February Up trendline – so I could dump them.
Because if the STOXX Europe 600 Bank Index falls off the trendline “ledge”, it could be another long way down to the bottom.
________
More from Dana Lyons, JLFMI and My401kPro.
The commentary included in this blog is provided for informational purposes only. It does not constitute a recommendation to invest in any specific investment product or service. Proper due diligence should be performed before investing in any investment vehicle. There is a risk of loss involved in all investments.